Nieman Foundation at Harvard
Everybody’s talking about the weather.
Weather.com is exploding with content, from longform to short docs to clickbait. Gawker just started a weather blog called The Vane. BuzzFeed recently launched BuzzFeed Storm (“A weather wire for the social web”) and, with fewer than 300 tweets, already boasts four thousand followers. And, as Charlie Warzel reported in BuzzFeed last month, Slate and Mashable are also hiring meteorologists-cum-bloggers.
There are a lot of converging factors that make this the right moment for a digital meteorology explosion. On the one hand, weather is emotional — it affects everyone, and it affects everyone personally. Storms can be both frightening and beautiful, and tend to produce compelling images for the increasingly visual web. Those factors make weather stories ripe for sharing on social platforms.
On the other hand, weather is also quantifiable. We can predict, to an extent, what weather is going to come, and we can measure it — be it in wind speeds or inches of precipitation. It is, in other words, a data-rich field that’s getting richer all the time; as the tools of data journalism continue to advance and popularize, journalists will be able to tell an increasing number of different stories about the weather.
On top of that, we’re living in the age of climate change, which means weather events have all kinds of governmental and political repercussions.
Stephen Stirling is the data weather reporter for NJ.com and The Star Ledger. He says weather nerds are typically defined by their “fascination with the unpredictable.” Weather, both climatology and meteorology, is an addictive topic precisely because of its combination of predictability and mystery. He compares tracking the two in tandem to a man walking a dog. “The dog is going to go all over the place; the man is going to follow a trend,” he says.
Nerding out about the weather online has a long and hallowed history. “There’s an intense community of nerds who have been on the Internet, since it existed, talking about the weather,” Stirling says. Social platforms, as they tend to do, helped bring some of these nerds out of the darkness, and into the public eye. Consider one self-identified “16 year old AMATEUR Meteorologist who loves studying weather,” with 14,000 likes on Facebook, or Weatherboy Weather, established circa 1991, according to his profile, with 165,000 likes.
Big accounts like these help stories about weather make their way across the web, and drive traffic for publishers. But lately, Stirling and other weather writers have begun to notice a worrisome trend. As with all things on the Internet, lots of important context can be lost when tantalizing bits of information are flung from account to account. This can be especially problematic when that information comes in the form of forecast maps, which sometimes seem to portend dire straits — like, for example, massive, potentially dangerous amounts of snow.
Stirling wrote a series of stories about this issue in February with titles like, “Monster blizzard headed to NJ? Probably not, but social media may tell you otherwise,” “The mammoth NJ blizzard that never was and will not be,” and finally “The NJ blizzard that wasn’t: The anatomy of a social media misfire.”
An Accuweather meteorologist had posted a forecast map to Facebook that predicted up to 30 inches of snow in parts of New Jersey. Because of the way forecast models work, maps that predict big storms are actually very easy to make. “If you were to take any point in time during the winter, seven to ten days out, you can probably find one forecast model that will show a ginormous storm,” Stirling says.
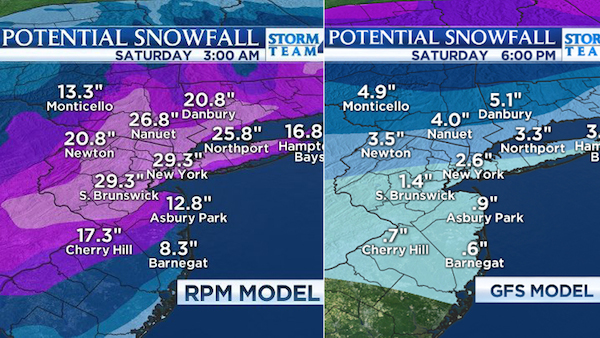
The image — thanks to those big weather enthusiast accounts — went viral. Eventually, Gawker posted the picture as well (“NYC Will Get Either 3 or 30 Inches of Snow This Weekend”). The problem was, the map was…wrong. Eventually, the National Weather Service eventually had to release a statement regarding false rumors of a storm, something Stirling says they’ve almost never had to do before.
“The National Weather Service in New Jersey and New York were flooded with phone calls. Emergency managers in New Jersey were flooded with phone calls,” he says. “Everyone believed this monster blizzard was coming to New Jersey, even though it was never actually forecast.”
As digital mapmaking technologies and data analysis tools advance, it becomes easier for anyone to create official-looking forecast images that, in actuality, aren’t representative of reliable science. Without a meteorologist standing by to explain, people tend to assume the maps are showing something that’s true, rather than something that has a very limited statistical chance of possibly being true.
“The problems arise when someone produces a map with one of these tools that can be misleading to the public, which unfortunately happens far too often. Sometimes it’s an accidental misinterpretation, but increasingly, it’s to draw attention to one’s Facebook or Twitter page or even to just watch it spread undue panic,” wrote Stirling in an email.
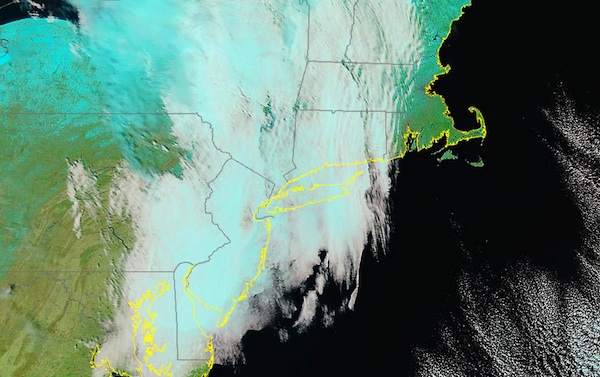
The Vane (Gawker’s weather blog) recently published a post called, “The 5 Best Sites for Awesome Weather Graphics,” that highlighted the very websites that make producing these images so easy. Writes Gawker’s Dennis Mersereau of popular weather sites, “while a good portion of them are freaky conspiracy websites run by high schoolers with inexplicably large followings, there are some true gems that many weather enthusiasts have yet to discover.” The websites mentioned include MODIS Today, Twister Data, and WeatherBELL — the predictive modeling image generator that was used to make the viral hoax snowstorm image.
Stirling agrees that these websites contain both good and bad: “Data in and of itself isn’t dangerous — it’s what you do with it. These sites are great tools. MODIS, for example, has some absolutely beautiful imagery on it that I’d encourage anyone who likes to marvel at our planet to peruse,” he says. “The trick is getting the general public to understand what a trusted source is and what isn’t.”
For journalists, it’s important to realize that there are a variety of compelling stories weather data can tell beyond apocalyptic predictions. Ian Livingston of The Washington Post’s Capital Weather Gang explored some of those other options during a panel discussion with Stirling at this year’s NICAR conference.
“They make some cool maps, but they also create high resolution imagery for every city, so you can basically rip these maps and post them without explanation,” says Livingston of the map generation sites. “As weather becomes more viral, we have to be really careful. Debunking stuff like this can be just as good as anything else.”
In February, instead of merely cut-and-pasting news of a tornado in Maryland, he used a GIS overlay to put into historical context, and found that it “was only the second reported in February in Maryland during the modern record which goes back to 1950.” He’s also found that snowfall total maps can be very popular. “People are obsessed with this ‘in my backyard’ idea of where snow has fallen, even after a storm,” he said.
Says Stirling, “The obvious weather story is: It’s fucking cold. But you’re not going to tell anybody anything they don’t know, because they’ve been outside today. But if you write that story, that it’s fucking cold, you can add context with data — how cold is it? You can articulate that fact, that this is exceptionally cold for this time of year in this region.”
In terms of debunking, Stirling says journalists can rely on experts, like the National Weather Service or academics. “If you look at something, and you see something going around that seems like bullshit, ask more about it before you go ahead and write about it.”
Image created via MODIS Today.