Nieman Foundation at Harvard
Election Day (more accurately, Election Night) is a great time for news organization to show off a little — to break out the visualizations, the maps, the real-time dashboards, the livestreamed video, and all the other digital tools in their toolkit. Like the Olympics and political conventions, election nights are both big and scheduled, meaning they can get months and months of planning. But most of the flash still relies on an old-fashioned set of numbers — the current rolling vote totals of each candidate. That’s what TV networks were posting up on set walls back in the 1950s, and that’s what you’ll see on most news sites tonight.
So this new data visualization, debuting tonight at The New York Times’ The Upshot, feels like one of the most important innovations we’ve seen. Amanda Cox and Nate Cohn:
More sophisticated analysts interpret leads through the lens of the outstanding votes. “There’s a lot of votes left to be counted in heavily Democratic Cuyahoga County,” Jeff Greenfield said on CNN in 2004. “Remember, some of the votes outstanding are down here in Marion County where Obama is winning,” John King said on the same network in 2008.
This year, The Upshot will aim to let you be your own John King. In about a dozen of the closest Senate races, we, like many others, will track the leads reported by The Associated Press. But we will also adjust those leads based on what we know about where the votes have come from. Our adjusted leads will be based solely on current and historical returns. They will not use data from exit polls, or any forecasts from Senate models. You’ll be able to find a link to the tracker on The Times’s midterm page and The Upshot’s home page.
So when a candidate takes an early lead in the hours after polls close, is that real or an artifact of where the early votes are coming from? If you know the historical data around specific precincts — how Democratic or Republican they’ve voted in the past — and you can make informed estimates about turnout, you can read into those numbers. (“Our adjusted leads will be based solely on current and historical returns. They will not use data from exit polls, or any forecasts from Senate models.”) Smart analysts have always done this; now readers will be able to see it in real time, not just in tossed-off anecdotal comments. Very smart.
Here’s how it would have worked in the Mississippi Senate primary earlier this year:
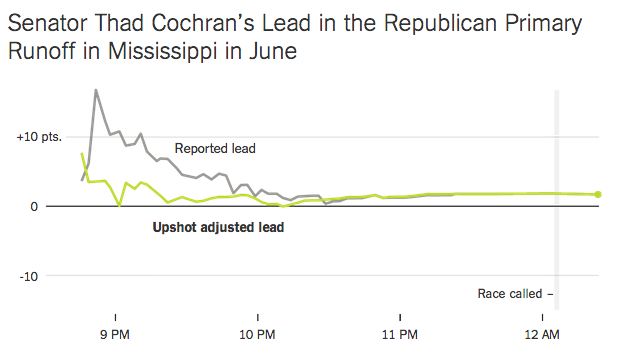
By the end of the night, those two lines will end up at the same point. But if you want to know who’s ahead in a Senate race at some point this evening, these Upshot estimates will probably get to that point a little sooner.