Nieman Foundation at Harvard


Stela — no, not “Stella!”; “story and events analytics” — is a Times analytics tool that pulls in data from multiple sources and presents it in one place, with simplified visuals and non-jargony categories catered towards journalists.
“We were looking for ways to help reporters and editors get feedback on the things they were being asked to do online, such as tweaking headlines, promoting to social,” Steve Mayne, lead growth editor at the Times, said. “And we believed it would be much more effective for us to actually have a tool to show reporters how, for instance, certain actions directly resulted in more people reading their stories.”
Stela opened to the entire newsroom in September 2015, focused on analytics around individual article pages. (A rough prototype, built during a hack week and incorporating only barebones metrics, had been first rolled out to the audience development team and a few interested editors.) It’s currently expanding to include better video analytics; the team is also playing around ways to deliver useful data points to reporters that they’ll actually bother to look at. Think a daily, desk-specific email, reporting analytics information in the body of the email, distributed in the newsroom.
Adoption was “tepid” in the first month or two, Mayne said, but Stela now claims 1,300 monthly users. (The entire Times news operation is currently roughly 1,300 people, but staffers in marketing and product also use the tool.) 10 percent of Stela usage comes from outside the U.S., mostly from The Times’ London and Hong Kong bureaus.

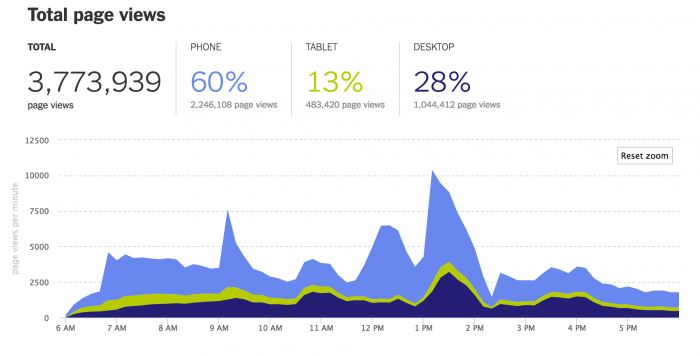
Stela pulls in data from the Times’ desktop and mobile websites, as well as all of the Times’ mobile apps (though not articles hosted off-platform, such as on Facebook’s Instant Articles). In addition to elementary metrics like pageviews and referrals (a section of the dashboard helpfully titled “How did readers find this story?”), Stela breaks down other data points such as the percentage of readers coming to each story from different countries (Nick Kristof uses it to see where readers of his international columns are coming from) and how many readers are subscribers, registered users, or anonymous traffic. It also pulls top comments and shows the social posts that are doing best, so that editors can see which Facebook or Twitter posts have been shared or retweeted most widely. Social media editors monitor Stela and can reuse language from the posts that have performed best, rather than trying to eyeball various Twitter or Facebook accounts for what appear to be popular posts.
The dashboard pulls in data in 10-minute increments and right now only covers up to two weeks of data — but most stories only have a one- or two-day window of significant traffic before they’re buried by the following news cycle, anyway.
“We’re excited to be hearing that this tool can be used to help develop story ideas,” Mayne said. “Often times, we’ll do a story and there will be a lot of comments, a lot of interest, and before you might have to pay attention to separate Twitter feeds or to the article comments. Stela highlights them for you, and editors can use that to think about whether they want to do a sidebar or a followup story.”


Like The Guardian and its much-beloved analytics engine Ophan, which Mayne credits as an inspiration for Stela, the Times focused on usability, conducting user testing and working with a designer. The dashboard uses Times typefaces and is structured to match the look and feel of the Times brand.

“As to why we wanted to build this all in-house: We were able to join together a bunch of data from disparate data sources. You can always log into Facebook, then log into Chartbeat, then log into Google Analytics, to find the data, but that just isn’t very reasonable,” Erica Greene, a developer at The Times, said. “It’s very valuable to display all the data in one place. We can overlay a Facebook post on top of traffic data so you can see the impact that Facebook had. We can track data when articles are put on the homepage. Reporters can see how different actions change performance.”
It’s also helped make tangible the importance of mobile-friendly writing and design.
“On so many stories, you’ll see 60, 70, 80 percent of readers coming from mobile, particularly for some of the breaking news stuff,” Mayne said. “We’ve been telling people that for a long time, but there’s a difference between that and actually seeing how much mobile traffic a story is getting. It’s getting our journalists to look at their stories on the phone, to ask: Is this too long? Did I have to scroll too many times?”

“It’s one of the questions we get most often when we train people on the tool for the first time: Is this number good?” Greene said. “We want to get better at answering people’s questions, without giving a single score. People have hypotheses going in about how their stories will do and where it should’ve resonated, and want to be able to evaluate them.”
“The problem with a lot of third-party analytics is that you don’t know what the data is actually trying to answer. We don’t want to obfuscate at all. We want to answer questions like how do readers find the story, how do readers promote a story, so there’s no confusion whatsoever,” Mayne said. “That was a really big goal of this as well: not only helping build an understanding of our audience, but also making that data approachable, and making it simple and fun to use.”