Nieman Foundation at Harvard
One of the features that made Instagram such a runaway success was its simple-yet-robust set of photo editing tools, which made it easy for users to tweak photos before sharing them with friends.

Farhan Mustafa, Grafiti’s CEO, said the app was a product of his experiences in the field reporting for Al Jazeera. While other journalists were able to use their smartphones to tell stories in the moment via text, photos, and video, it was nearly impossible to do the same with charts and data, which required more sophisticated software on his laptop. “I had some stories I wanted to get out there, but I just couldn’t do it,” he said. “All I had was my phone.”
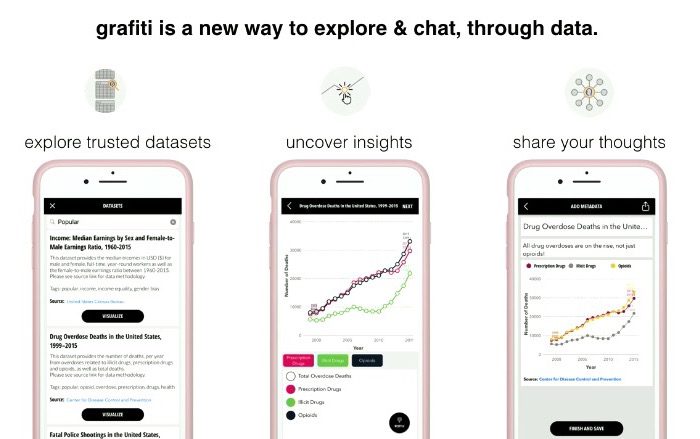
Grafiti aims to streamline the process of introducing data and charts to storytelling. When users open the app, they can search Grafiti’s archive of verified datasets and then visualize elements of them using the app’s charting tools, letting them restructure and restyle their charts before sharing them with others. There’s also a conversational component. During his demonstration at Matter’s demo day in October, Mustafa used a hypothetical feud between two friends over the YouTube popularity of the songs “Despacito” and “Gangnam Style” to show how Grafiti’s charts can be the basis for conversations.
“Our core question is: How can we introduce facts into storytelling on a more immediate basis?’ Mustafa said. “We want to make it easier for people to respond to facts in the moment, especially in social conversations. These days, we have all these conversations about policy and immigration where data comes up, and it’s amazing how much plain text is still used to explain these ideas.”
Grafiti is also trying to make its way into newsrooms. Here, the pitch is centered on a central issue bogging down news organizations, particularly small ones, as they try produce more data-driven stories. In a report published in September, Google News Lab found that over 74 percent of data-driven stories take more than a day to create. Grafiti is designed to speed up that process, largely by collecting the data and cleaning up, which together take up “80 percent of the work,” said Mustafa. Simplifying the process will also help make it easier for reporters who lack intensive data skills to incorporate data in their reporting, which is particularly vital for smaller newsrooms “We want to help make it so that this a normal thing that anyone can use, not limited to teams at places like The Upshot that spend lots of money hiring a great team with interactive developers,” said Mustafa.”We want to figure out how to make all of this more accessible to local newsrooms, which can just plug and play the visualizations.”
Grafiti is in different stages of pilot projects or has had conversations with news organizations including The Economist and Thomson Reuters, which are looking for ways to integrate the app in their news production and presentation. UNICEF, too, is using the tool. Francesco Marconi, strategy manager at the AP, said that the organization has experimented with Grafiti, which “showed that, if fully integrated, it could democratize how data stories are told, particularly in situations where visualizations can provide context to breaking news.” He added that the AP has encouraged Grafiti to continue to build out its pool of datasets, which needs to be more expansive if Grafiti wants reporters to keep coming back to use the tool.
More broadly, Grafiti wants to do its part to help expand the public’s overall comfort with using and understanding data. But Mustafa says that, thanks to the proliferation of fitness trackers, that’s an increasingly easier lift. “Everyone is checking their steps today, so this idea of checking data and understanding it isn’t as crazy of a thing anymore. People are looking at data all the time and don’t even realize it.”