Nieman Foundation at Harvard
It’s an annual moment of print realism here at Nieman Lab: the posting of the attention/advertising slide from Mary Meeker’s state-of-the-Internet slide deck. It’s enough of a tradition that I can now copy-and-paste from multiple versions of this post. Here’s a sentence from the 2013 version:
For those who don’t know it, Meeker — formerly of Morgan Stanley, at VC firm Kleiner Perkins since late 2010 — each year produces a curated set of data reflecting what she sees as the major trends in Internet usage and growth. It may be the only slide deck that qualifies as an event unto itself.
And a chunk from the 2014 version:
What’s useful about Meeker’s deck is that its core data serves as a punctuation mark on some big, ongoing trends. The kind of trends we all know are happening, but whose annual rate of progress can be hard to judge. Like, say, the continued demise of print.
The Meeker slide that always interests me most is the one where she shows how American attention is divided among various forms of media — and how that division lines up with where advertising dollars go. How much of our attention goes to television, say, versus how much of our advertising goes there?
It’s not absolute dogma that the two — audience attention and advertising dollars — will always be equal. But it makes sense that they would tend toward parity. More people listening to the radio should lead to more companies advertising on the radio, or vice versa.
So let’s travel back in time. Here’s Meeker’s chart for 2011:

The two things that jump out at me: Print gets a lot more advertising than it gets attention. And mobile is the opposite. You’d think that would equalize with time.
Here’s 2012:
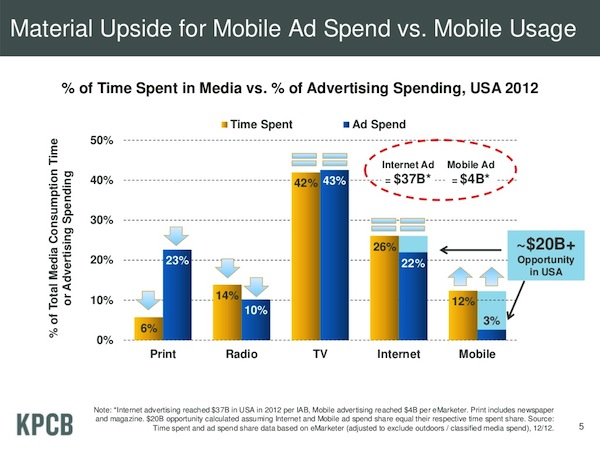
Equalization! Or at least the path to equalization, proportionately. Print loses attention, but loses ad dollars a bit more quickly; mobile gains attention, but gains ad dollars a bit more quickly.
Here’s 2013:

The print story remains the same: down in attention and in ad dollars. But note there’s still a wide gap between the two — print is still getting far more ad dollars than its hold on American attention would seem to “deserve” in 2013.
Here’s 2014:

The mobile growth everyone anticipated is happening — moving from 4 percent to 8 percent in 12 months’ time. And print continues to lose both time spent and revenue.
Here’s 2015:

On the positive side, print’s share of attention remained steady at 4 percent. The ad-side trend, though, is unchanged — down another two points from 18 percent to 16 percent. And note another huge jump for mobile advertising, from 8 percent to 12 percent.
Here’s 2016:

Take a look at mobile! Up from 12 to 21 percent of ad revenue in one year. By 2016, we were spending about 30 percent more time looking at media on our phones than on our laptops and desktops. And mobile still had room to grow — though given that the vast majority of new digital ad revenue goes to Google or Facebook, that new money wouldn’t be going to publishers.
And then there’s print — steady in time spent for the third straight year, but another big drop in ad dollars, from 16 to 12 percent. That lines up with the evidence that the decline in newspaper print advertising accelerated in a big way in 2016.
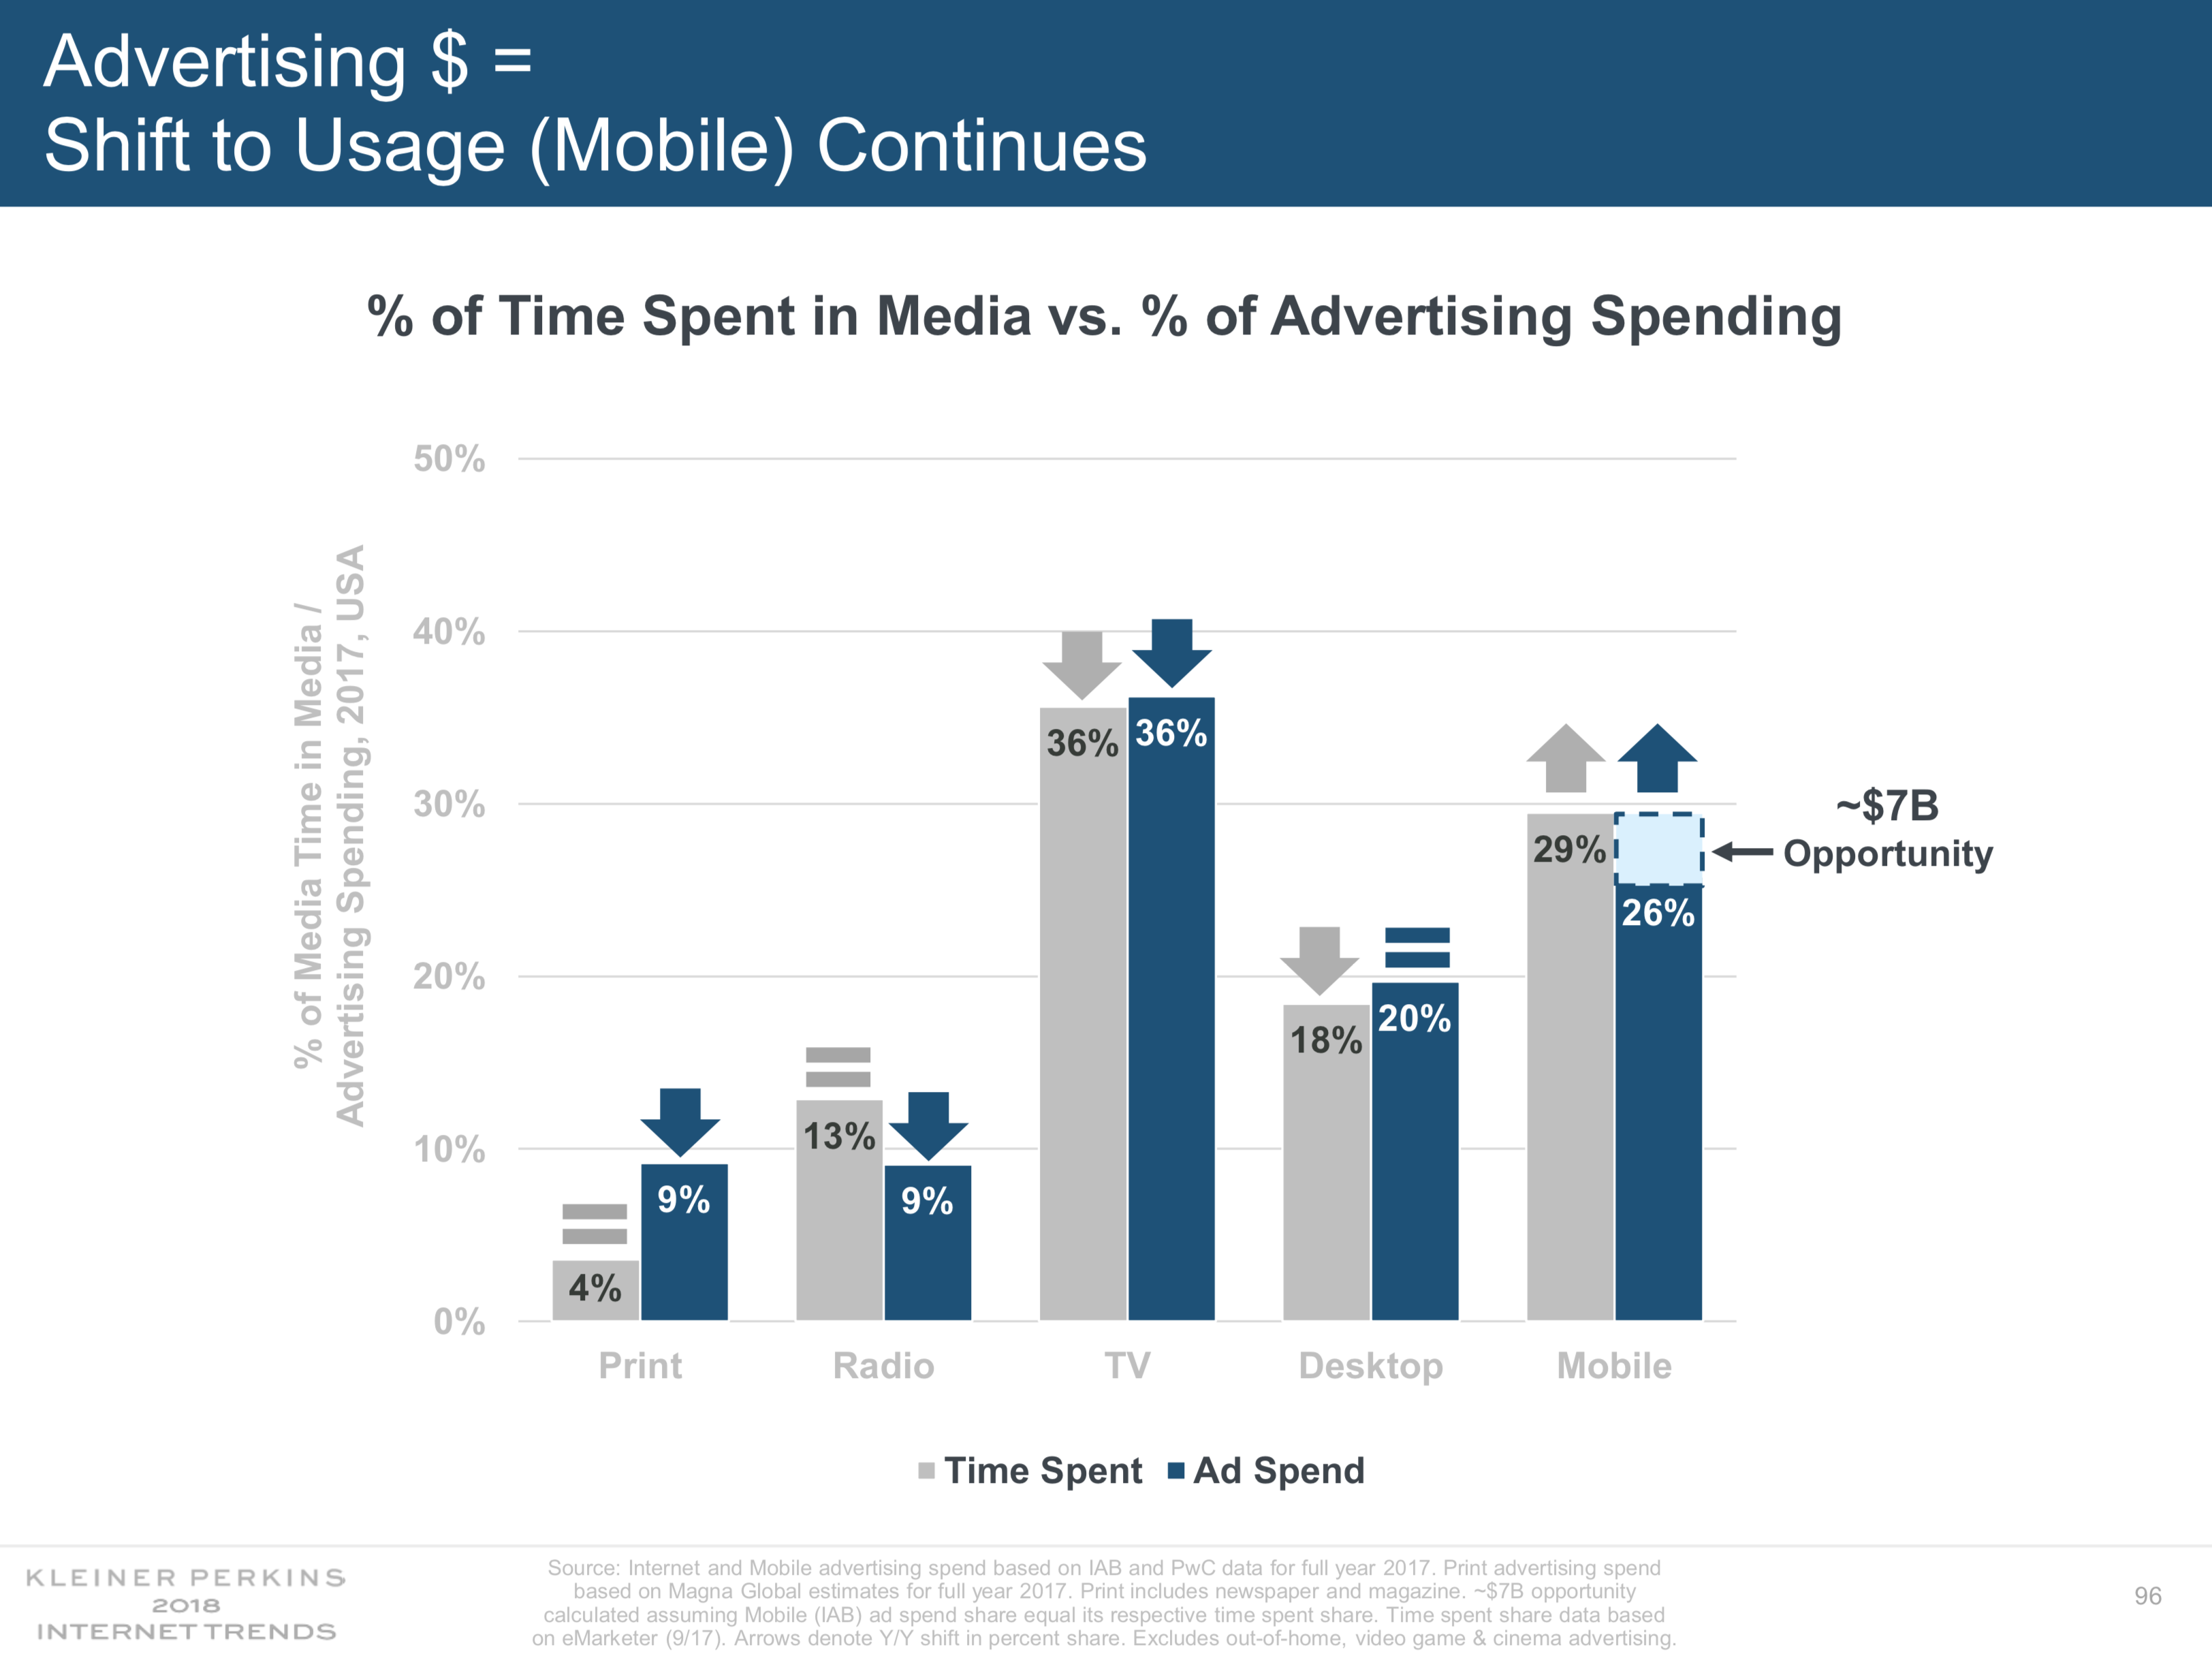
Finally, here’s the newest slide that debuted today, for 2017 (it’s slide 96):

By this point, it’s pretty remarkable that print has been steady at 4 percent since 2014. That fact has informed a lot of newspaper pricing strategy in the past half-decade or so: The remaining people consuming news in print tend to really like it and have multi-decade habits built up. They don’t want to change.
(You’ll note, though, that when the numbers get that small, you’d need roughly a 25 percent decline in attention share to drop from 4 percent to 3 percent. So steady doesn’t necessarily mean steady — it just means a pace of decline lower than that. And of course we don’t know if any of those 4 percents are really 3.51 percent or 4.49 percent, either.)
But over that same time period, the share of ad dollars going to print has been cut in half — from 18 percent to 9 percent. In other words, we are definitely seeing what I wrote back in 2013: Over time, attention and ad dollars will equalize. Dollars follow eyeballs wherever they go.
So the good news is print’s hold on its remaining customers has been pretty stable. The bad news is that, if attention and ad dollars really do equalize, print ad dollars will probably get cut in half again — even with that loyal customer base.
Meanwhile, the party continues over in Mobile Land, where usage has now blown well past the desktop Internet. It took until 2016 for all of digital (desktop + mobile) to pass TV in total ad dollars; it wouldn’t be shocking for mobile alone to pass TV this year or next.
Let me wrap up by copying what I wrote five years ago, since the overarching trends haven’t really changed since then:
Print advertising is not coming back. It will fall further. Substantially further. All newspaper planning for the coming few years needs to reckon with that basic fact.
Mobile continues its rocket rise, and there’s still lots of room for ad revenue growth. And now it’s even eating away at the Great American Time Suck, television. Mobile is eating the world, and most news organizations make only a pittance off it.
There’s lots more interesting stuff in Meeker’s complete deck. A few nuggets that stood out to me at first glance:
— Slide 6: Global smartphone shipments aren’t growing any more. The low-hanging fruit in the West has largely been picked, and people are keeping their devices longer.
— Slide 11: Americans spent 2.7 hours a day consuming digital media (in one form or another) in 2008. In 2017, that number was 5.9 hours.
— Slide 18: When surveyed, people in 16 countries (including the U.S., U.K., and Canada) said that roughly 60 percent of their most recent “everyday transactions” took place in some digital form rather than in an actual store. (The not-so-slow decline of brick-and-mortar retail removes a key source of the ad dollars that supported local news in the last century — among many other things, of course.)
— Slide 69: E-commerce advertising revenue is rising in a big way at Google, Facebook, and Amazon. (Amazon’s growth here — these are ads paid for by someone else appearing on Amazon listing pages we’re talking about — has been huge, doubling year over year)
— Slide 76: Advertisers say they are valuing “customer lifetime value” more and more as a metric of their ad spend. That, in theory at least, could be decent news for publishers, which are at a major disadvantage vs. the platforms when it comes to transactional advertising, but have a stronger argument to make when it comes to brand-building-oriented, long-term value.)
— Slide 81: The New York Times’ digital subscription growth rate (43 percent in 2017) is close to the growth rate at Spotify (48 percent) and ahead of Netflix (25 percent), Dropbox (25 percent), and Playstation Plus (30 percent). (Of course, they’re all growing off of much larger existing bases.)
— Slide 84: Total news-consuming sessions on mobile in the U.S. increased by 20 percent from 2016 to 2017 (thanks, Donald). Shopping and music/entertainment media grew at a higher rate; games and “lifestyle” sessions actually shrank YOY.
— Slide 97: Ad dollars in digital roughly doubled just from 2014 to 2017 in the U.S. ($43 billion to $88 billion).
— There’s also a fascinating section near the end all about the Chinese Internet, which often feels like an entire other universe from the U.S./Europe Internet. The growth is huge; today 9 of the 20 largest Internet companies by market cap are Chinese (led by Alibaba and Tencent).