Nieman Foundation at Harvard

Editor’s note: This, based on data from the analytics firm Parse.ly, is the second half of a series on traffic trends at news sites; check out Part 1, which explores traffic growth (and the reliability of that growth) for each of the platforms below, here.

I love discovering quirky insights in our data at Parse.ly — anything that challenges my perspective of what’s “normal.” But true breakthroughs coming out of any sort of data, referral or otherwise, are actually relatively uncommon. That’s usually a good thing: If new surprises popped up every single day, I promise your job would be harder than it is already. Data should not constantly surprise us. And in fact, this trend of SmartNews and Flipboard sending news sites more traffic didn’t surprise us.
Flipboard has been a growing source of referral traffic since 2017. More recently, SmartNews’ growth caught our attention in November. Lots of people use these apps, and more do every day — even if you don’t know them. In fact, these apps perfectly illustrate the difference between changes in reader behavior and changes in product.
Referral growth caused by product changes means there’s been an app redesign or an algorithm update that in some way encourages (or discourages) people to come to your site. You can put Google in 2018 and Facebook in 2017 into this category: Google added a number of ways for people to discover content directly within its products, and Facebook, of course, changed its News Feed algorithm.
Referral growth caused by changes in reader behavior can certainly be influenced by product changes — but sometimes it’s much simpler than that. While Google and Facebook are unlikely to add many more users, SmartNews and Flipboard have lower market penetration and awareness — which means they have more room to grow. The corollary to that is that many people still haven’t heard of them — or heard of anyone they know using them.
More are learning about them though. SmartNews ran television ads in 2018. Flipboard made a product change that pushes more traffic to sites directly and has a team of 25 to 30 editors. (Keep an eye on Pinterest on this front in 2019, as they hired their first CMO in late 2018.)
The steady pace of growth at these aggregators actually shows the impact of successful product marketing. And, for the record, we don’t see any suspicious traffic patterns — like, say, a ton of pageviews at midnight exactly — that would indicate bots or pre-caching pages trying to “fake” growth numbers.
We can’t say when their user growth will tap out, and of course it’s unlikely that any given platform will get to Facebook or Google’s size. But for now, we see the trend continuing.

Okay, now to the actual Part 2 promised. Let this be an exercise in discovery rather than a blueprint for gaming the next algorithm. Zooming in on each platform allows us to put some of the aggregate numbers from Part 1 in context. in context. We looked at content over the past three months (November 2018 through January 2019) to get a snapshot of the most current audience interests on each platform. What kinds of material are Twitter users most interested in? How about Flipboard users, Google searchers, or Drudge Report clickers? We examined four dimensions:
Of the millions of posts published since November 2018 that we studied, the median length was 529 words, with a lower quartile of 261 words and an upper quartile of 998 words. Most content ranged between about 200 and 600.
Where do very short text posts do best? Pinterest, Facebook, Instagram, SmartNews, and both Yahoo Search and other Yahoo referrals. In the case of Pinterest, image-heavy posts or short instructional ones might do best. In the case of Facebook, perhaps it relates to the stat reported by Bloomberg that, while users spend 45 minutes a day on Facebook, “the average Facebook session lasted less than 90 seconds…while you were waiting in a checkout line, trying to avoid eye contact between subway stops, or sitting on the toilet.”
How about longer pieces, those over 1,000 words? Linkedin, Reddit (non-app), and the Drudge Report send proportionally more traffic to longform posts.

Mobile traffic grew 25 percent during 2018. That matches other trend reports in the market, including Mary Meeker’s report showing growth in both time spent with mobile devices, tablets, and other connected devices, but a slight decline on desktop.
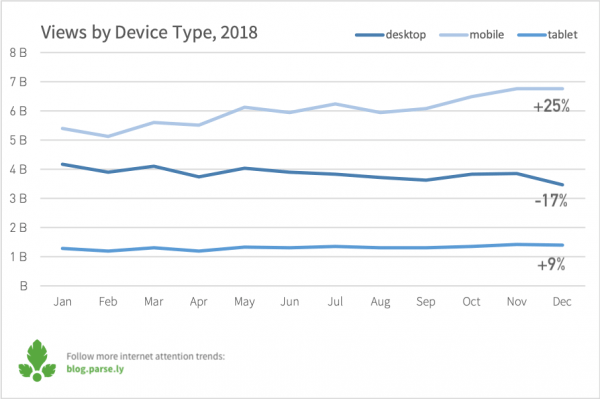
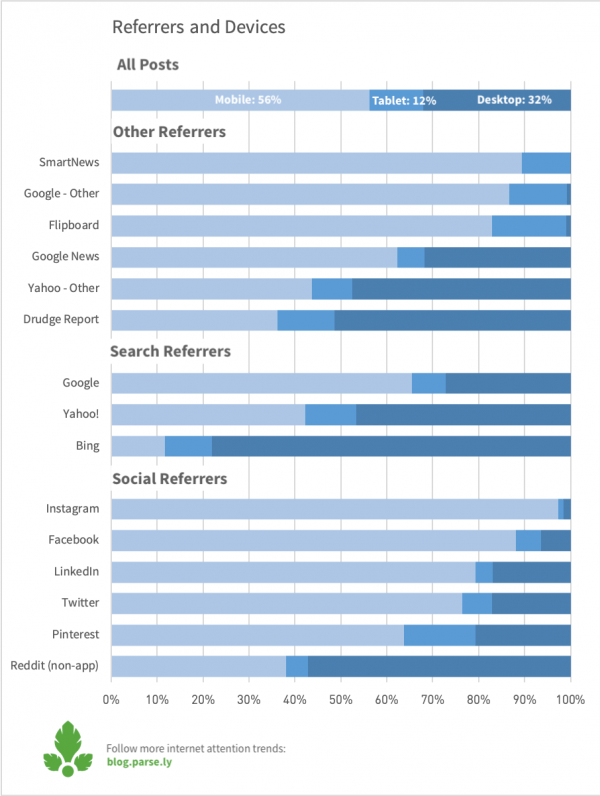
And surprise, surprise, the apps that saw the most growth last year — SmartNews, Flipboard, Instagram, Google’s “other” referrals — also tend to have most if not all of their audience on mobile. More search-based platforms as well as Google News buck this trend, still generating high desktop percentages.
Please note: The desktop experience is not dead! Desktop has much higher rates of direct and internal traffic referrals — indicating that email, direct visits to homepages, and chat apps (Slack, anyone?) are driving a lot of visits. Related content or “read next” modules likely work better when there’s more screen to see them.
Desktop traffic also leans slightly more toward business content and long reads, with platforms like LinkedIn showing a higher percentage of readers in both categories. (Don’t confuse this with the idea that people won’t read longform on mobile — they do.)
One slightly surprising exception to this is Pinterest, with lots of short posts, steady referral traffic, but also a higher desktop audience. Its new CMO described the Pinterest audience as “very unique” to Adweek, saying “We’ve learned that users turn to Pinterest when they are actively looking for something, but still open-minded about what the specific answer could be.” Perhaps that unique mindset means its referral patterns look more like search than other social networks.
With mobile traffic comes the slow takeover of AMP. AMP is a Google product, sure, but it expands far beyond Google-owned products. It may help to think of it as a quick-loading template rather than a channel or platform itself — that is, a template that can be used across any platform, but which opens in a Google webview (i.e. not your default mobile browser). And it’s everywhere — stay tuned on that front.
A little context for categories first. As part of our Currents platform, our system reads the full text of every post on our network in order to determine what the article was about. (You can read about how we use NLP and machine learning to do that.) Here we’ll explore the top 10 categories per platform, and you can explore the full list of categories here.
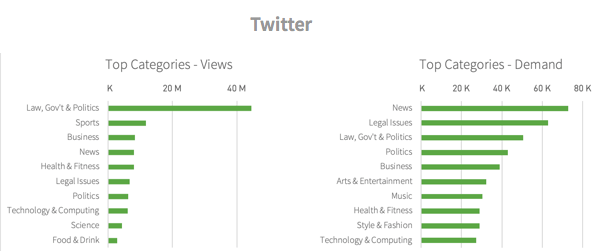
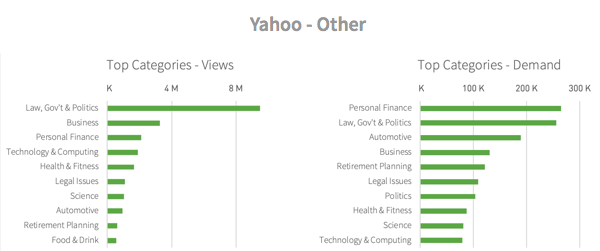
For popularity, the metric we’re looking at is simple: the total number of pageviews for a given category from a given referrer.
For demand, however, we’re looking at a slightly more nuanced view — the number of pageviews per article, for a given category from a given referrer. High numbers there could indicate that people would like to read more stories in that category, but that there aren’t enough on the platform to satisfy that demand. But low numbers could also just mean it’s a category that already has a lot of articles. For example, the Sports category tends to appear as if it’s in “low demand.” But there are already lots and lots of articles written about sports, many of them short summaries or iterative updates, which deflate the volume of readers per post.
If you’re trying to decide which platform to invest resources in, consider our growth stats from Part 1.
![]()
But also consider where your content falls in the charts below. Is it a category that’s in high demand? Is it popular, but also heavily saturated? If a platform poses an interesting opportunity for you, consider experimenting with the in-demand categories, which could garner higher views per post.
Each referral source’s categories for the Nov 2018-Jan 2019 timeframe is shown below in order of 2018 views growth. The Law, Government & Politics category tops many of the referral sources for popularity, as it’s the most-read category across our network. The three exceptions to this include Pinterest, Instagram, and LinkedIn, though Law, Government & Politics still ranks highly for both Instagram and LinkedIn. (It’s nowhere to be seen for Pinterest.) Google Search and Twitter both have Sports as their second most popular category.
Demand varies much more widely across the different platforms. To explore any category further, or see more recent data, click through to check it out in Currents.
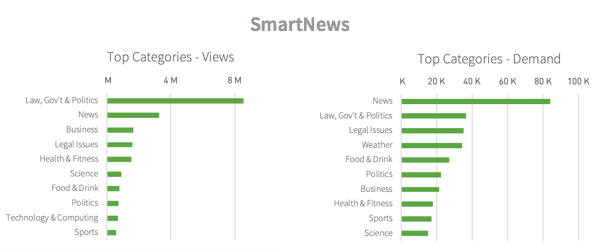
Explore SmartNews referrals in Currents.
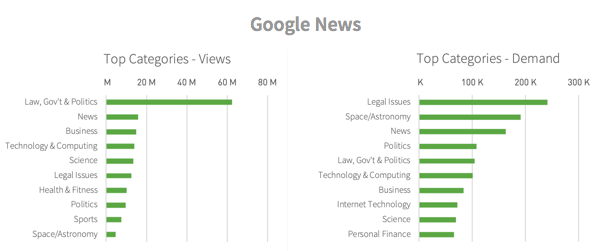
Explore Google News referrals in Currents.
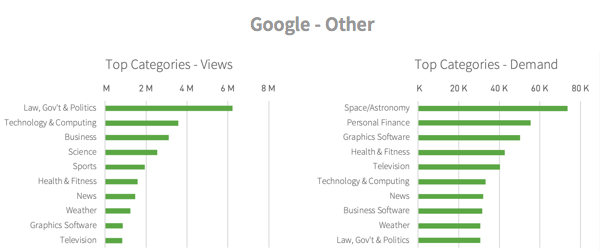
Explore Google — Other referrals in Currents.
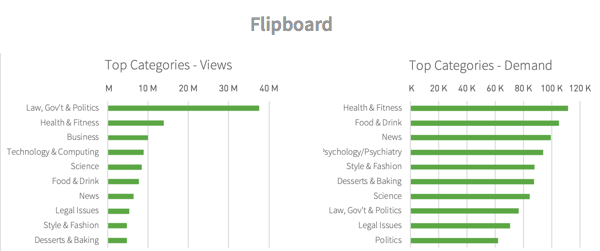
Explore Flipboard referrals in Currents.
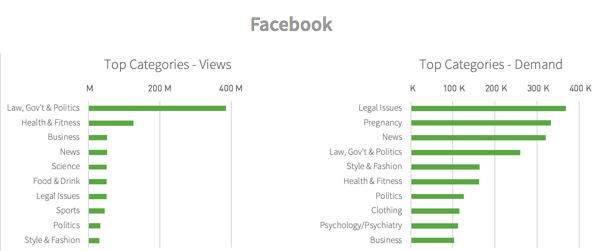
Explore Facebook referrals in Currents.

Explore Instagram referrals in Currents.
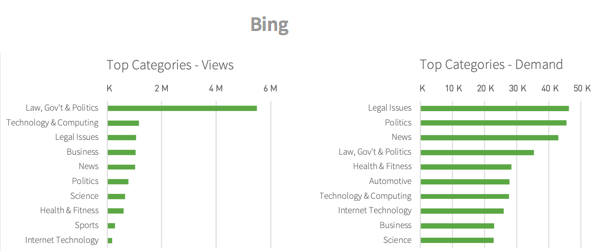
Explore Bing referrals in Currents.
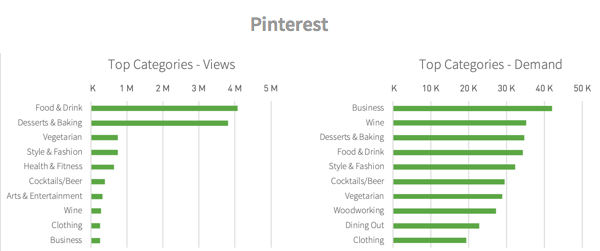
Explore Pinterest referrals in Currents.
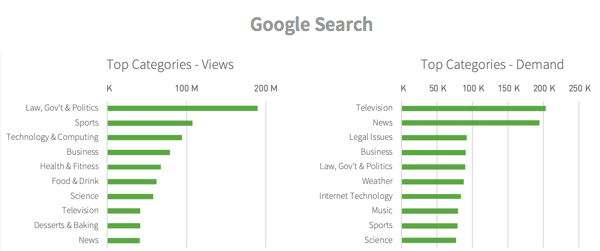
Explore Google Search referrals in Currents.
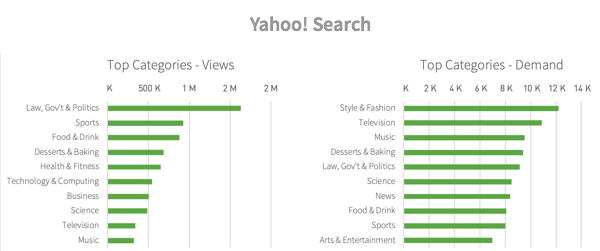
Explore Yahoo! Search referrals in Currents.

Explore LinkedIn referrals in Currents.
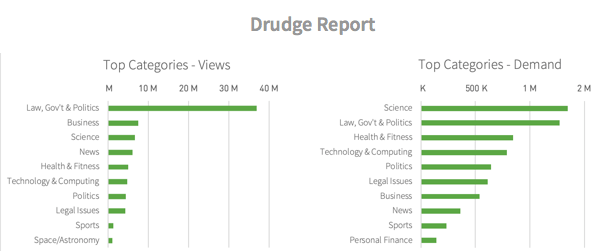
Explore Drudge Report referrals in Currents.
Explore Twitter referrals in Currents.
Explore Yahoo — Other referrals in Currents.
If you’ve made this far down, I’ll add that there was one other piece of feedback that I loved hearing: “Thank you for validating me and my work.” And so to wrap this study, no — thank you for you and your work. You’re the one making these things happen. Did something confirm your suspicions? Seeing something completely different than what we’re seeing with your data? As always, tell me about it! I promise to dive into the numbers with you.
And if you’d like to take all of this information with you or dive into a specific referrer, sign up at the form at the bottom of this page to download the full PDF of every referral source, the specific numbers for each, and my hot take on each one.
Kelsey Arendt is a senior data analyst at Parse.ly, where a version of this piece appears.