Nieman Foundation at Harvard

Data has a habit of giving us advance signals about particular trends. It shouts: “Hey, something big is happening.” Like when we saw Facebook decline for six months before they announced official changes to their News Feed.
Some of those trends jump out more than others. Wouldn’t it be great to predict how reliable those trends are? Things change fast online. I would want to be sure about a trend before investing resources in chasing it.
So, using data we’ve gathered at Parse.ly, let’s take a deep dive into how platforms have changed over the past year — looking not just at the sheer size of the traffic shifts, but also how quickly they change. Platforms that look promising (SmartNews and, yes, still Flipboard), platforms that look like they’re slipping (Twitter), and platforms that cannot make up their damn mind (looking at you, Google).
I want to distinguish reliable growth from shiny growth. And if it’s reliable, I want to know what’s driving that growth. Changes in reader behavior? Changes in the product? Both need to be identified and understood. And you need to know if those changes should affect the content you produce and audience you work to reach.
I’m going to spend this piece, the first in a two-part installment, laying out which platforms we should probably keep an eye on this year. In the next post, we’ll dive into whether specific types of content are working on these platforms.
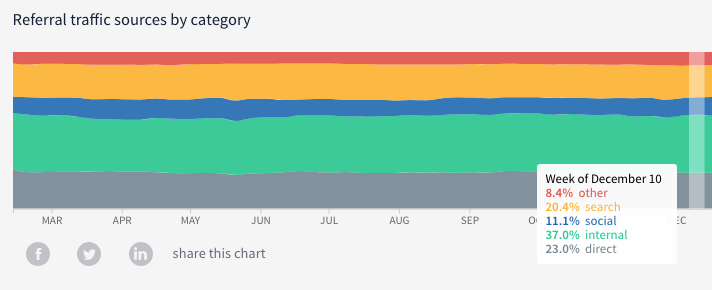
First, the high-level summary:
Let’s start on the right foot: In any given week in 2018, internal referrals — meaning someone going to a second (or third, or 30th) page within your site — made up over 35 percent of traffic. People who come to sites do keep reading. Internal referrals drove more traffic than direct referrals and more than any category of external referrals (search, social, or other). The people making content now own so much of that traffic — a fact easy to forget with the drama of Facebook and Google playing out in the news.
Direct referrals are also up a smidge. In my four years working directly with Parse.ly-powered sites, email traffic usually makes up a good chunk of that. With a heavy focus on newsletters and subscriptions this year, that should be validating.
Okay — those are the people you’ve already convinced to engage with your work. Where should you go to find new audiences, meeting them where they’re already engaging? For each category and referral below, I’ve broken them down by looking at two stats. First, the annual increase or decrease in total views referred to our network. Second, I looked at the average monthly increase or decrease, plus the standard deviation.
Annual change: +21 percent | Average monthly change: +3 percent, +/- 17 percent
Let’s start with “other” referrers. That’s how we classify any identifiable external site that is neither search nor social. It’s not the largest, but is the most experimental. At +21 percent year over year, it’s also the fastest-changing category sending traffic to our network. You can expect these news aggregators and other referral sources to change anywhere from -14 percent to +20 percent monthly.
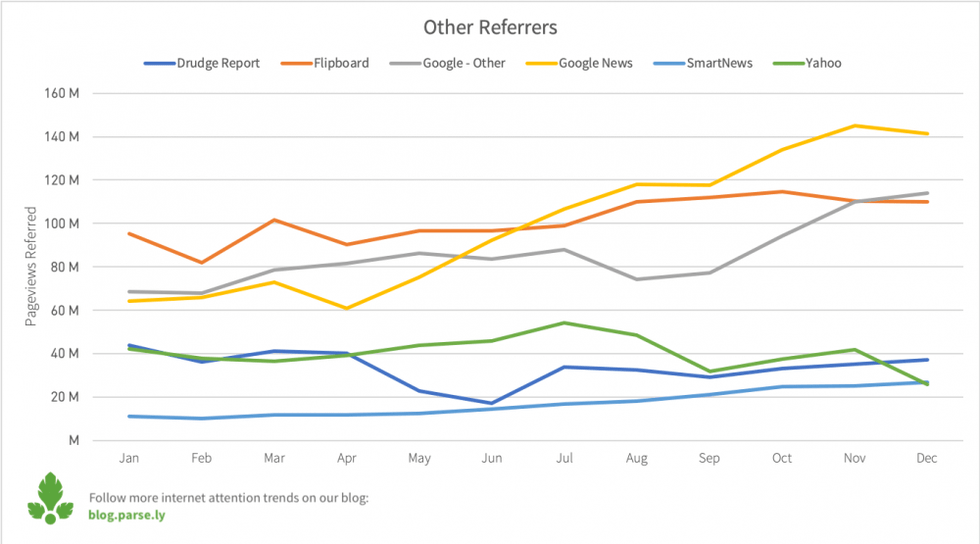
SmartNews. If you’ve been lurking around any nerdy news Slack channels or audience-focused Facebook groups, you’ve probably seen this name making a splash! Not the largest external referrer by a long shot, but is up +145 percent year over year, and growing at an average of +9 percent month over month, with a steady trajectory upward. SmartNews is the most reliably growing external referrer. In a good month, you might see your traffic from SmartNews grow up to +17 percent, but even a “low” month will generate +1 percent growth. Big 👍🏽👍🏽 here — get on board.
Flipboard. Hey kiddo! Flipboard still shows growth, over two years after we first saw them really show up towards the top of our referral lists. They’re trucking along! Up +15 percent year over year, with fairly reliable growth month over month, 👍🏽
Google News. Google News is very likely still on a path to grow, at least in the short term (short term for me is a few months, not like…by this weekend). We’ve written about Google News referrals before, but holy moly, as the largest domain by volume in this category, +120 percent year over year growth is nothing to scoff at. It’s on the bigger side, but expect monthly changes anywhere from -4 percent to +20 percent.
Google Other. This is all the ways Google serves you content that aren’t search and aren’t Google News. Confusing? Yep. I have some thoughts as to why, but it’s the second-largest domain in this category, so we’ll continue watching this one closely. The biggest changes here happened in the latter half of 2018, falling on its face a bit in August, but then climbing fast with the launch of Google Discover and other Google content recommendation products. It’s clear that Google wants this to work, and is making it easier for readers to find content outside of a specific platform. We expect it to continue, but here too, don’t bank on identical growth a year from now (at least not yet).
Yahoo News. Yahoo News is down -38 percent, but month-over-month changes vary more than other sources in this platform. It’s on the lower end of top referrers in this category, so for some, this might not make a huge dent. I’m not going to say “don’t bother,” though: Yahoo non-search traffic could change anywhere from -21 percent to +17 percent month over month, which indicates its potential to rebound.
If you’re reading this, I assume I don’t need to tell you that Drudge Report is the least reliable traffic source on the internet. Even when Facebook fell, it fell reliably. But in case you do need to hear this: drudgereport.com is down -15 percent year over year, and month-over-month change could range anywhere from +39 percent to -33 percent, generously. At its best, it grew +99 percent, at its worst, it fell -43 percent. With this kind of fluctuation, I don’t particularly care why. If it works for you, don’t look a gift horse in the mouth. But don’t bother investing much in the horse either.
Annual change: +9 percent | Average monthly change: -0.6 percent, +/- 13 percent
Social doesn’t change quite at the same pace as “other” referrals, but it’s not far behind. On the whole, it’s up +9 percent year over year, largely thanks to Facebook. But average monthly change on any social platform is about -1 percent, but give or take 13 percent (compared to -14 percent to +20 percent from the “other” category). I don’t know if you needed further proof that social is a fickle beast, but there you have it.
That said, I hope that sets a new standard. Social platforms, big and small, can be expected to change anywhere from -14 percent to +12 percent month over month. That’s the norm.
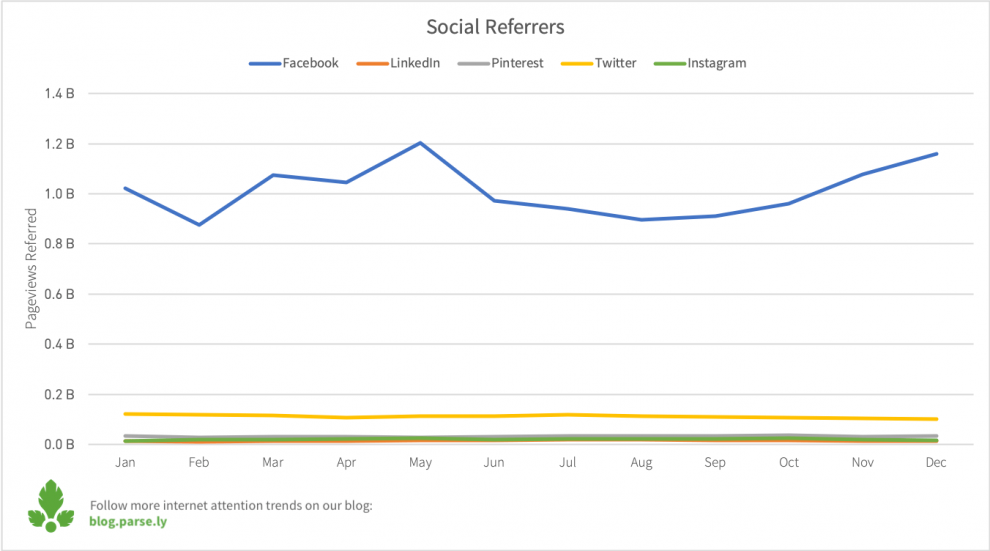
Facebook. Not new, but a new perspective. After all we’ve been through, Facebook traffic is up +14 percent from a year ago. It’s been a reliably growing source of traffic since August. The beginning of the year was rocky though, and it shows: Facebook can still be expected to change +2 percent +/-12 percent month over month. I still give this a vote of cautious confidence, though, because of the smooth growth five months in a row. That might surprise you, but its month-over-month change is still within what’s “normal” for social media, and smooth growth is more indicative of real, engaged audiences, not product changes that are out of our hands. Perhaps their string of bad decisions is making them realize they need quality content again?
Let’s zoom in on that graph again, this time without Facebook.
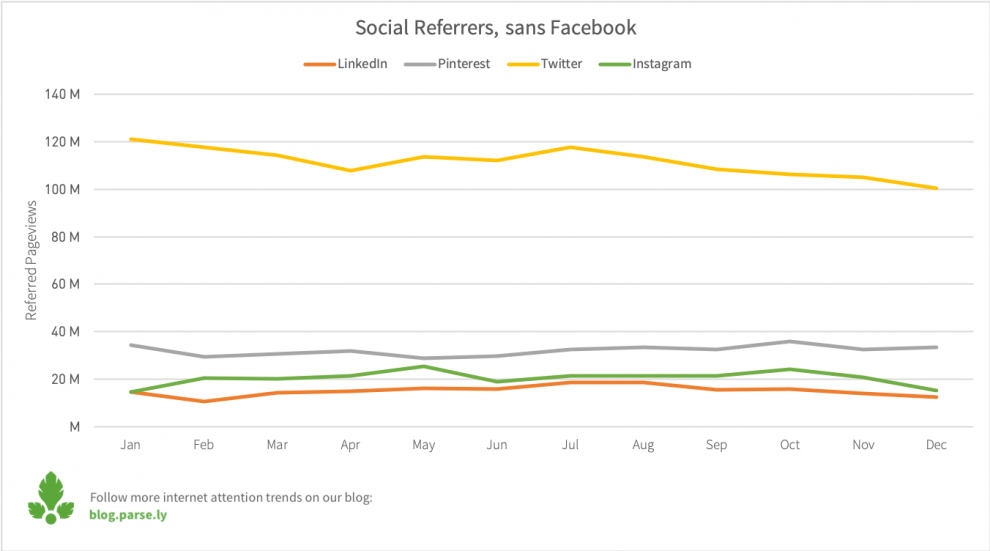
Instagram. I could say many of the same things about Instagram, considering its ownership. The social app is up +4 percent year over year, but it is the least reliable social platform. In a good month, you could see +21 percent growth; other months, you lost -17 percent. When it works, it works really well. I suspect that these results go beyond product changes at Instagram; I know many newsrooms who have experimented with niche audiences on Instagram and succeeded. So I can’t help but wonder if this is a platform that could use a bit more audience engagement effort. And for that reason, it’s the platform I’m most excited about to look at specific audiences and content for (stay tuned for part II of this piece!).
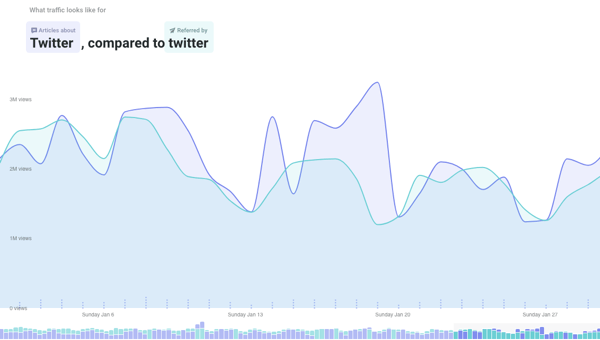
Twitter. From January to April, Twitter referrals dropped -11 percent. Things then started to rebound, until July, when it began to slip back down. Year over year, Twitter is down -17 percent. However, it has the highest deviation in this category, meaning it’s very possible that it could rebound again. This is another platform we’ll be focusing on heavily in Part 2, as we’ve found in the past that Twitter, like Instagram, resonates with particular audiences and not others.
There’s also a question of Twitter’s perceived influence versus its actual size as a referrer. There are more views to articles about Twitter than views from people who find articles and stories on Twitter.
LinkedIn. Talk about a mainstay. Articles have floated LinkedIn as a potential foil to Facebook, but this is not a platform in search of the limelight. It’s down -14 percent year over year, but was on the rise until August. In many ways, its trend was a lot like Twitter’s, where any early traffic gains were a wash by the end of the year. But negative delta aside, it deviates the least out of this group with average monthly changes just below 0 percent, give or take 4 percent.
Reddit. Reddit really took a beating this year, but this observation comes with a big caveat: The Reddit mobile app (like many social apps in years before) doesn’t send referral data, meaning the traffic that comes from it shows up as direct. (Some people refer to this as “dark social.”) Reddit is down -52 percent year over year, and unfortunately, changes less month over month than others — meaning it’s likely to continue downward. Perhaps their app usage has increased, which is likely given other mobile trends. (We left it off the main chart because of the unknown quantity of app traffic.)
I want to point out something specific to this part of my analysis, because I imagine this is something social media, audience engagement, and marketers struggle with too: I was very tempted to give Instagram, Twitter, and LinkedIn more positive trajectories: “They’re not doing so hot right now, but social media changes more than other platforms! If you’re not on social media, do you even exist??” Those perceptions are real.
But consider that combination of (a) the variability of month-over-month change across all social platforms and (b) downward trends in the last half of the year for Instagram, Twitter, and LinkedIn. Trust the numbers for what they are. But they’re also what prompted us to dive deeper into the nuance of each platform by what specifically what kinds of audiences are engaging with. Stay tuned for Part 2.
Annual change: -4 percent | Average monthly change: -0.3 percent, +/- 7 percent
We’ve written a bunch about search over the last year, and for good reason. Google dominates this space, and on any given day it makes up around half of our network’s external traffic and a quarter of overall traffic. Our past study of the Google Quick Search Box being as prevalent as it is could suggest that content recommendations to Google’s various not-News and not-Search products are being curated based on search results. These content recs are a bit of a black box, but if that’s true, it means your SEO game will matter for more than just search rankings.
I’ll briefly review Google, Bing, and Yahoo, but unlike social referrals, search referrals are…pretty boring. And that’s probably a good thing for now. On average, each platform changes at around +0.5 percent per month, +/- 7 percent.
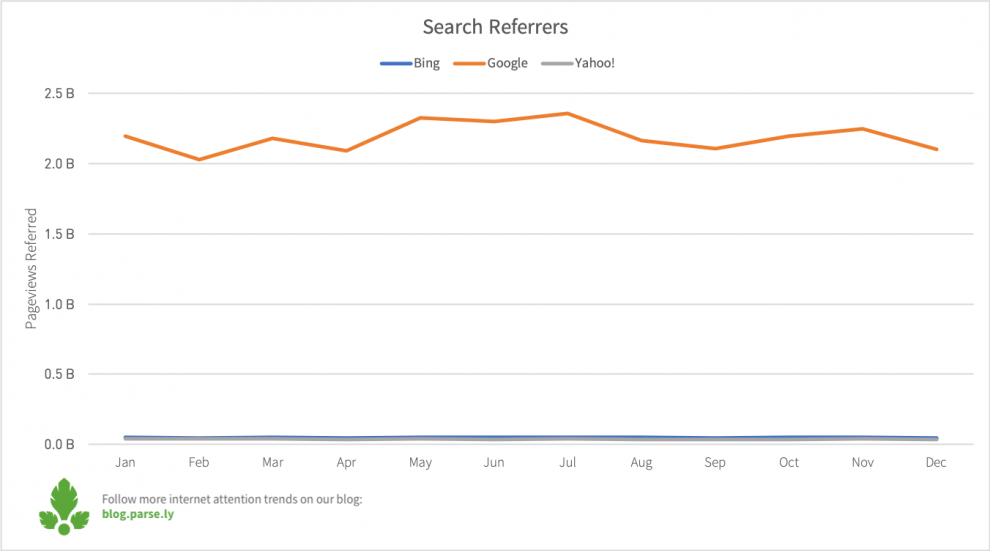
Google. Now, +/-7 percent is a big deal when you’re talking about a quarter of total traffic. The behemoth is actually down -4 percent year over year, and varies the greatest of all search platforms, at +/-9 percent. That puts it in the red as far as “normal” for search refs go, but that’s also what calls for a practical outlook here. Google dominates all search traffic, and it’s not going anywhere anytime soon. It doesn’t really matter what is “normal” for search refs when most of your search refs are Google. Expect Google to give or take +/-9 percent any given month, usually dependent on major breaking news stories.
Bing. Bing changed the least year over year, only down -2 percent, with the least amount of change month over month. If you get traffic from Bing, don’t expect any surprises (that might be good news for you). 👍🏽
Yahoo. Yahoo is the smallest of the three, and it’s down the hardest, at -9 percent year over year. Its change was also slow and steady, and I do expect the trend to continue in this direction, so 👎🏽 for that reason. Now: Yahoo’s product portfolio is a diverse one. It’s possible that this decline in Yahoo search is in favor of other products, like the additional content recommendations Google has been experimenting with.
And that wraps Part I of this installment of referral traffic predictions. Remember, even with the best data, this post will still probably get a few predictions wrong. As Google non-search traffic has shown us, platforms experiment with how they get readers to engage all the time. We’re going to dig into what’s happening right now, but we should all acknowledge the possibility that a product change in the next few months could swing your traffic in a new direction. Take these predictions with a grain of salt; they’re not gospel.
In the meantime, I want you to experiment with platforms and crush it. I want you to experiment when the odds are stacked against you, and still crush it. I’m a skeptical optimist: I don’t always think things are going to work out, but I really, really want them to, and I think our best chances start with understanding this data.
![]()
Kelsey Arendt is a senior data analyst at Parse.ly, which published a version of this piece.