Nieman Foundation at Harvard
A bunch of money — check. A bunch of local data — check. Brains galore — check. Future of local news? TBD.
When University of Southern California professor and Wall Street Journal alum Gabriel Kahn was given part of a grant made to USC’s journalism school, he sat down with a professor in the computer science department. He wanted to know what that department was seeing and learning and how it could be retooled with journalism — specifically, local news.
The CS folks had been contracted with LA’s traffic department for five years to analyze its data, and a giant load of data (for instance, all the signals from road directors that can be used to calculate traffic density and speed) had been stockpiled. The data just kept on coming, but could also be broken down into smaller sets for different areas and — the magic word! — localized. “Could we make these large datasets into hundreds of locally relevant datasets and then turn that into something like a local news feed?” Kahn wondered.
It was a big ask, but Kahn — along with computer science department chair Cyrus Shahabi — had big resources to work on it: The grant provides around $120,000 per year for five years, and the team now includes part-time data scientists to crunch the numbers, designers to visualize the trends, and journalists to put it all into context. This is Crosstown LA, a nonprofit news project based at USC, but it has the potential to expand to other regions.
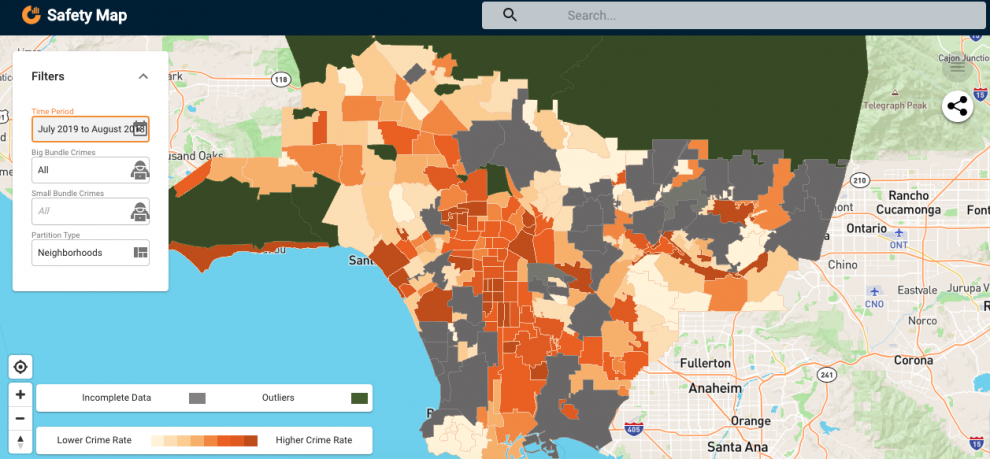
Crosstown uses publicly available data on LA’s traffic, air quality, and crime to analyze trends and report local — really local — stories from that. Kahn compared it to the police commissioner sharing updates on the city’s yearly crime statistics. How are the numbers impacting each neighborhood? That’s the wedge Crosstown is trying to get at, though it’s still in the developmental phase (with a plan for future monetization). Some recent stories:
Kahn hopes that as the team develops its system for analyzing and formulating the data (it’s automated at a minor level at this point, with, for instance, a slackbot that tracks reports of hate crimes), it can be scaled to more datasets and more locations. “When we do a story looking at 18 different commuting routes, we’ve created 18 different stories, in a way — we’ve created a story with 18 distinct audiences,” he said.
One wrinkle: The data isn’t always completely comparable; reporting differs across police departments, and certain types of theft might be broken down differently in different areas, for instance. And officers don’t always record the time of a crime, in which case it’s automatically filled in as midnight. How do you scale nuance? “We learned a lot of the idiosyncrasies of police data. You need to get close to the data and understand its flaws and limitations,” said Kahn. With practice, “we feel much more confident about what we can report on.”

In the case of the health and air quality stories, Crosstown consults with public health experts on how to responsibly interpret and share the data. Readers email Kahn for advice about the environmental safety of certain areas, he says, and the team wants to make sure people can draw the right conclusions from the work. It’s one reason they include a “How we did it” section at the end of each article explaining the data sources and interpretations:


KPCC and LAist have worked with Crosstown to publish reporting on traffic delays, and a Facebook Community Network grant of $25,000 will help Crosstown envision more ways to share its data and collaborate with more local news outlets in southern California. The team has also compiled its findings in one-pagers and brought them to neighborhood council meetings. In the future, Khan is thinking about developing hyperlocal newsletters and creating a membership program.
“If we can take regularly occurring data about crime, real estate, and public education and package it into a weekly newsletter,” he said, “that would be 110 different newsletters” across the city.