Nieman Foundation at Harvard
Newspapers could borrow a line from a recent Dilbert comic strip: “We’ve been doing great since we redefined success as a slowing of failure.” Or perhaps it was the other way around, and Dilbert creator Scott Adams was inspired to write that line in a recent strip by the inventive terminology of newspaper executives describing “sequential improvement” and “moderating declines” in their revenue trends despite continuing losses in the double digit range.
Currently, the industry is reporting first-quarter earnings, and last week the Audit Bureau of Circulations released unaudited “publisher’s statements” reporting paid circulation for the six months ending March 31. The numbers are down, but the spin is up.
On the circulation front, the Audit Bureau of Circulations reported that circulation fell 8.7 percent on weekdays and 6.5 percent on Sundays, among newspapers filing publisher’s statements. This compares with drops of 10.6 percent weekdays and 7.6 percent Sundays for the prior six-month period, enough of an improvement for Newspaper Association of America CEO John Sturm to declare that “the data indicates the declines are moderating.”
Actually, it’s hard to discern real moderation in the rate of decline. The losses in the most recent period are indeed a bit less severe than those in the prior (Sept. 30) period, but they are worse than the drop in the period before that, or in any previous period. If we ignore the Sept. 30 data as an outlier, we actually have a trend that’s been worsening steadily for the last six years:

Nothing about that final uptick indicates that it’s a reversal of the trend — it would take two or three periods of “improvement” in the form of “moderating declines” to make that a valid conclusion. In fact, both of the upticks in the trendline disappear if we take the statistically reasonable step of averaging spring and fall six-month circulation changes into annual figures and graphing those:

Moreover, viewed in long-term context, this latest minor slowdown in the rate of decline disappears entirely when newspaper circulation is viewed in the context of population: Since 1945, the number of papers sold per 100 households has dropped steadily, declining in 61 of the last 64 years.

(The circulation numbers on which this chart is based come from Editor & Publisher via NAA; E&P hasn’t released its Yearbook with a 2009 figure, so 2009 is my estimate based on the last two ABC cycles and estimated census households.)
It’s also quite possible that the uptick is entirely the result of some of the new options newspapers have in counting their circulation. Some of the declines of the past few years have come from ditching distribution in unprofitable outlying areas, and cutting back on “third-party” programs in which advertisers were persuaded to pay for bulk distribution, free to recipients, at community events or door-to-door in targeted areas. The value of this circulation was always questionable, but now ABC rules are permitting substitution of new forms of questionable circulation.
Take, for instance, the Bend (Ore.) Bulletin, where weekday circulation grew 34.3 percent. How? Since Jan. 1, with ABC approval, the paper has been counting e-subscriptions sold to current print subscribers for an extra 50 cents per month. As long as the subscriber can choose to opt in or out of the added digital subscription, the e-subscription counts as one paid subscription in addition to the printed one, even if the customer never accesses it. Applying this stratagem for only three months of six-month reporting period, the Bulletin tacked 12,462 weekday e-subs to its “core” print circulation of 29,072 (which is actually down by more than 1,000 from 30,155 a year ago). And next time around, counting the e-subs for six full months, it expects to report circulation of about 54,000.
How much of that is going on, and to what extent is it responsible for that uptick? I haven’t delved into the data, but Paid Content did, and reported that e-edition circulation was up significantly: the digital editions of the top 25 newspaper e-editions rose 40 percent, from to 1,363,212, versus 973,721 a year earlier.
There’s are other questionable figures being circulated, as well. In his statement on the ABC data, Sturm also cited readers-per-copy data that appears, at first glance, to mitigate the downward trend in copies sold: “Newspaper print products are also finding their way into more people’s hands, with readers-per-copy increasing by 7.5 percent in just the last three years to 3.3 adults on average, according to a recent analysis from Scarborough Research and Newspaper National Network LLP.” Here’s the graph:
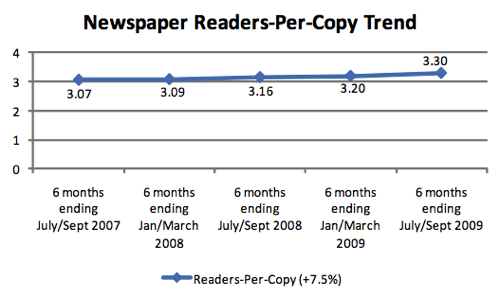
Missing from this statement is the important qualifying statement that the Scarborough study applies to 25 selected “top markets,” not to all newspapers.
For its report (PDF download), Scarborough chose the 25 largest newspapers omitting “national” newspapers (New York Times, Wall Street Journal, and USA Today), as well as omitting papers in the midst of major circulation pattern transitions (Denver Post, Detroit Free Press, Philadelphia Inquirer, San Jose Mercury-News, Seattle Times and Seattle Post-Intelligencer).
In response to email inquiries, NAA’s research director Jim Conaghan and communications chief Jeff Sigmund defended Sturm’s statement. “He correctly cites the Scarborough research,” Conaghan wrote. “John Sturm’s statement references research conducted by Scarborough which was based on an analysis of the top 25 markets,” Sigmund wrote. But Sturm’s statement leaves out the important qualifier of the 25 markets. Conaghan also wrote to me: “You need to carefully read what is contained in the Scarborough report. Large markets/papers, survey data. The old NAA estimates were derived by a different method, and would represent total U.S.” By “old NAA estimates” he meant a 2007 report available at the NAA site that found 2.128 readers per copy weekdays and 2.477 on Sunday. (That study, in a footnote, discounts the validity of the Sunday number, stating: “Projection relatively unstable for Sunday RPC. Use with caution.”
Now, as that quote suggests, readers-per-copy (a.k.a. the “pass-along rate”) is a notoriously difficult thing to measure. But it has been tracked by Scarborough and others for a very long time and has been pretty consistently cited (and drilled into the heads of newspaper advertising representatives) as being around 2.3, plus or minus a point or two. This allowed salespeople for a 30,000-circulation newspaper to tell retailers that readership was actually about 75,000. The readers-per-copy factoid was included for years in NAA’s own “Facts About Newspapers,” a vest-pocket sized booklet of data distributed annually to advertisers and publishers. In 2000, Facts About Newspapers claimed 2.1 readers per copy, and 2.2 on Sundays. In 2004, it was 2.3 on weekdays, 2.4 on Sundays. In 2007, as cited above, it was 2.1 weekdays and (with a grain of salt in the NAA footnote) 2.5 on Sundays. When I started in the business, in the late 1970s, I recall that it was 2.6. In 1983, Scarborough and Simmons both came up with about 2.7, but that was noted as seeming to be on the high side. The average U.S. household is about 2.57 people, another reason why any reader-per-copy finding above that level is questionable. I think Conaghan is right on the money to say that Sturm’s claim of 3.3 can not be applied to any markets outside the those selected 25 and that reality is still in range of 2.2 to 2.5 as it has been for 50 years.
Sturm also pointed to the online newspaper audience, stating: “The latest Nielsen Online data found that newspaper websites attracted a record 74.4 million unique visitors per month on average in the first quarter of 2010 — more than one-third (37 percent) of all Internet users.” Left unsaid: the monthly UV average for this quarter was probably boosted in February by traffic related to the Olympics. The February UV count was 76.1 million, an all-time high. In March, with 10 percent more days than February, UV’s were 5 percent lower at 72.1 million. [See update below.] NAA reported 71.6 million average monthly unique visitors to newspaper websites during the first quarter of 2010, the lowest quarterly average since the June 2009 methodology change.
But everyone knows by now that UVs are not a very good indicator, and “time spent on site” is what counts, at least if you’re trying to sell advertising. By that score, Q1 did not shape up very well for newspapers: in January, the average visitor spent 33:09 34:10 minutes at newspaper sites, in February, 29:06 31:39 minutes, and in March 32:21 minutes. These are three of the four seven shortest attention spans recorded by Nielsen Online for NAA since January 2004 (with the caveat that data before June 2009, which showed significantly higher times spent, was based on a different survey sample and can’t be compared with later stats).
Here’s the trend line for attention, or time spent, at newspaper websites since the June 2009 methodology change.

When that trend starts to demonstrate clear and strong “sequential improvement,” newspapers will have something to shout from the rooftops.
Update, May 14: NAA has issued a correction to the Nielsen data it previously reported for January and February 2010. Since the revision changes the quarterly UV total from 74.4 million to 71.6 million, the correction negates the NAA’s previous claim that “websites attracted a record” number of UVs in the quarter. The revised numbers are reflected in the updates to the final section of this post with strikethroughs. Also, the chart showing time spent per person at newspaper websites has been updated. At our end, we erred in stating that January through March were three of the four shortest attention spans — we should have said three of the seven shortest; this was not affected by NAA’s data correction.