Nieman Foundation at Harvard
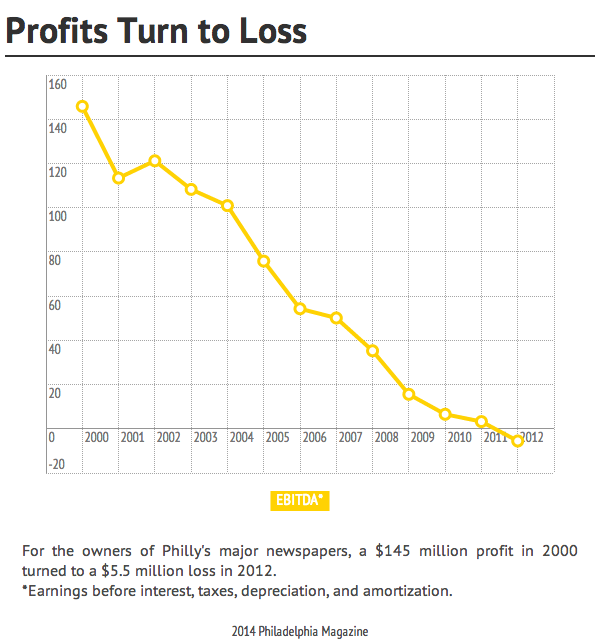
We don’t spend a lot of time focusing on what happened to the American newspaper industry in the first decade-plus of this century — what’s past is past! — but this piece by Joel Mathis in Philadelphia magazine is a useful visual reminder. They obtained an internal document from the company that owns The Philadelphia Inquirer and Daily News detailing the decline in the papers’ financial state from 2000 to 2012. (One presumes the document comes from the financial data distributed to potential buyers of the papers in that last year.)
You can go there to see the plummeting totals and get some more context. But I think you’ll get the point with these two charts:

(One gloss on that first chart: You might see the difference between “Print Ads” and “Total Ads” and assume the difference is online advertising. That’s part of it, but the significantly larger part is preprint advertising — mostly the loose circulars that get packed in with the Sunday paper. Yeah, that’s all printed too, but it’s not included in the “Print Ads” segment above.)