Nieman Foundation at Harvard

[Our series profiling winners of the 2009 Knight News Challenge continues with Ben Cohen writing about Aaron Presnall’s data-visualization grant. —Josh]
Aaron Presnall is neither a journalist nor a developer. He’s a political economist who specializes in the role of participation and information in decision-making. His job makes him acutely aware of journalism’s impact on democracy, and he knows that sound data informs good decisions.
 He also understands that only a handful of news outlets can afford to invest significant resources in the beautiful-yet-intelligible presentation of such data, which is why he plans to use his $243,600 Knight News Challenge award to build an open-source data visualization module targeting community newspapers, independent journalists and bloggers — really, anyone interested in publishing data visualizations. With a team of five coders and designers, Presnall hopes to launch a beta version by December; the initial sample visualizations will focus on alternative energy and eco-issues in Belgrade, where he has been stationed with the Jefferson Institute for seven years.
Tools to visualize data are nothing new, and the market has already produced several attempts to make them accessible to non-geeks. But Presnall believes his project can push the difficulty and cost of data visualization down further and encourage its use among those who wouldn’t have considered it before.
“What we’re trying to do is to take that a step further and say, look, these kinds of visualization tools should be available to anybody,” Presnall told me. “Any creative individual, any small community news outlet, should be able to have the same kinds of data visualization tools as The New York Times and Washington Post at their easy disposal, so they can tell their essential community stories, so they can inform their local activists in community decision-making. And that’s really what it is — it’s about breaking down barriers to informed decision-making.”
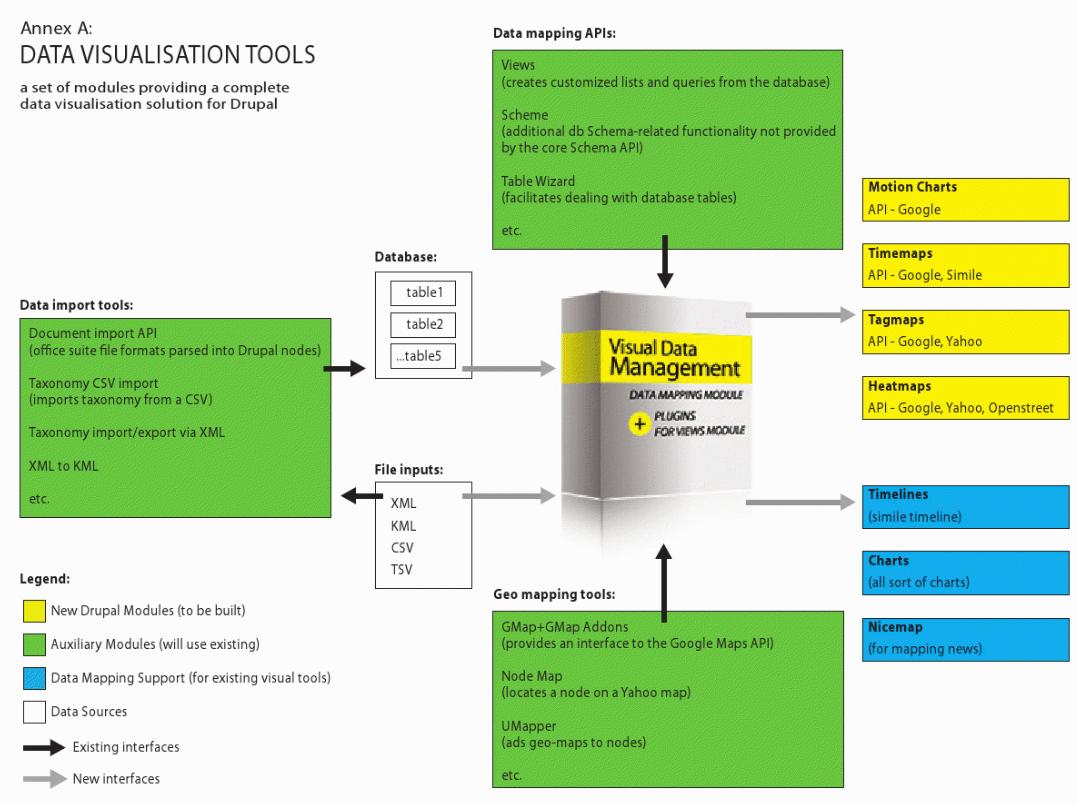
The tangible goal of Presnall’s project is a data-mapping module to import raw data in a variety of formats and export it in an accessible manner. The site will be built in the popular content management system Drupal, and Presnall plans to include several export options — motion charts, timemaps, tagmaps, heatmaps, timelines and nicemaps, among others. Perhaps the biggest challenge, he told me, will be balancing simplicity and complexity — making sure it’s accessible enough for novices and advanced enough for experts.
Although Presnall insisted that data visualization isn’t the answer to every question — nothing wrong with a simple table — he does believe seeing data visually plays into something primal about the human brain.
“A lot of how we gather information news is visual, and the brain is able to process information extremely fast visually,” he said. “This is why data visualization works so well, because as humans, we’re really well-equipped to process information that way. We can capture patterns and essential themes in huge data sets very, very quickly through visual means, and at the end of the day, it’s about empowering people with that information.”
The next step is returning to the Drupal community to determine what progress has been made in visualization tools since the project was first pitched to Knight last fall. From there, Presnall anticipates “a really intense autumn of coding,” followed by the beta launch by December. Before all of that, though, something more immediate looms.
“First,” he joked, “we throw a big party. Now the hard work begins.”
The image above is a visualization of mentions of Germany, East Germany, and West Germany in The New York Times between 1981 and 2009. It was created by Vancouver artist Jer Thorp, whose terrific work we’ve mentioned before.


