Nieman Foundation at Harvard

About a year and a half ago, a team of developers and journalists won $450,000 from Knight to redesign Census.IRE.org, now known as Census Reporter. The funding for that project expires this spring, after extensive user interviews and demos. It’s interesting to look at what nearly half a million dollars and a year can do to the accessibility of a data set to a journalist. Understanding how people think differently about quantitative information can be a serious challenge — and it’s a useful example to any number of editorial projects that could benefit from structured thinking about user needs before planning get too far down the road.
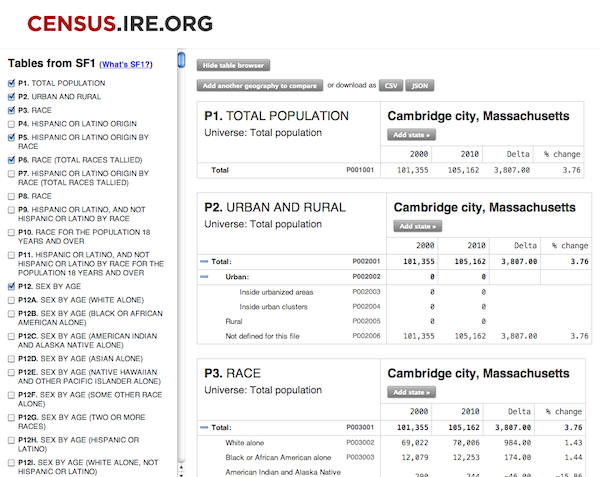
With a wide diversity of possible users in mind, project lead Joe Germuska, of Northwestern’s Knight Lab, hired Sarah Schnadt, an information architect with a background in the arts, as a community liaison and designer on the project. “In a way, I feel like I’m an outside eye on this project. All the challenges are new to me,” she says. “When I look at the interface, I just want it to make sense — I haven’t been using census data for the last ten years.” To get a sense of just how much has changed, take a look at the results for a search for our hometown of Cambridge on the Census.IRE.org site:
And compare it to how basic census data for Cambridge looks on the new site:
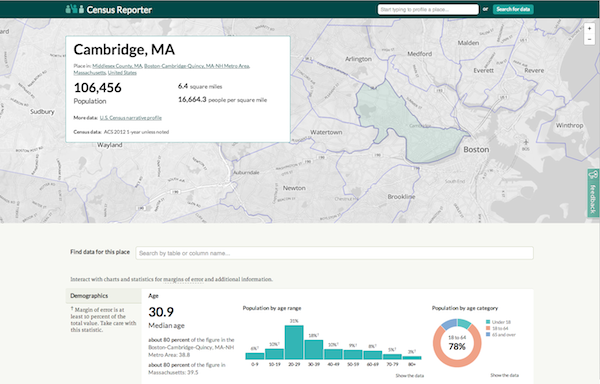
There are two primary ways to access data in Census Reporter. For a journalist seeking to understand the narrative of a location, the place page is the best entrance. It’ll automatically generate a map, basic profile information, and charts on the most commonly used census data — population, gender, income, race, and so on. The charts are interactive — hover over a bar on a graph and you’ll see useful contextual information for data points. They’re also responsive for mobile.
On @CensusReporter, wide column charts flip to horizontal bars on a phone. Same data, different view. This is nice. #NICAR14
— Chris Amico (@eyeseast) February 28, 2014
The place profiles, says Schnadt, are great for answering the question, “What can I find out about the place that is my beat?” But other journalists are looking for a more quick and dirty service — they want to get in, find the tables they’re looking for, and download them quickly in the format of their choosing.
“More statistically oriented journalists talked about not knowing if they have the right data set until they’ve downloaded,” says Schnadt. “They download one and see, and then download another and see. It takes five different downloads to even see if maybe three of those tables might be the ones they want to combine together to get at maybe two numbers that they want for a story. We know from those kinds of conversations that we’re making a process much easier.”
Schnadt also wanted to make it easier for reporters to understand how the tables correspond to what they’re looking for. “There are 1,500 tables but only 60 questions that are asked. It can get kind of overwhelming,” she says. To figure out how best to surface the most important information, Schnadt analyzed census-based stories to try to figure out which queries matched the most frequently used data points. In addition, Census Reporter has built some static resources around explaining census terms.
The core challenge of the Census Reporter project was to figure out how build an interface that would be as helpful to newcomers as to developers and trained data reporters. To get a sense of users’ needs, Schnadt administered a survey in which she “tried to identify the level of detail in which a journalist is using the data — how they think, what kind of background they have, what kind of newsroom they’re working in, and a little context into how they’re using the data,” she says.
This process produced user profiles that went beyond the basic expert-beginner dichotomy. In between the end points of “narrative thinker” and “app developer,” there were roles like graphics journalists, who typically want to work with raw data via tools like ArcGIS or Tableau and are often the most technically skilled person in the newsroom — but who may not always have a set of skills or needs that perfectly aligns with the “journo nerds” — journalists learning to become developers.
“The thing that’s hard is building for all of them at the same time, because they have very different needs,” says Schnadt. “If we can make the process of getting at this data a pleasure and also make the tool seem very useful, than we can also serve this broader goal of encouraging more journalists to use data in interesting and creative ways in their stories.”
As development of Census Reporter reaches its conclusion, there are a few final steps for the team. By June, they say publishers will be able to embed their charts, and they’ll be using elasticsearch to make the full text of the database easily searchable. They’ll also be taking steps to make the source code for the project convenient for other developers. (Those features will be the handiwork of front-end developer Ryan Pitts and back-end developer Ian Dees.)
The biggest challenge, however, is preparing to move the project into “life support mode” — one that falls to Germuska, as well as project board members Pitts and John Keefe. The primary issue there is updating with new data as it’s released, but they’re also interested in continue to develop new features.
Some, like adding deeper economic and social context to the place page charts with more specific data, could potentially be good projects for journo-nerd students, like those Germuska has met through his work at Knight Lab. Other projects, like comparative place pages that allow users to look at two locations side by side, could be good candidates for Knight Prototype Fund grants, Germuska says. The team is working on basic design sketches that could help guide future Census Reporter code contributors. Even so, not every feature can get built — for example, providing year-over-year historical context proved to be too complicated, because of the way that data is gathered and shared.
“After spending a year and a half on this, I have so much sympathy for the Census Bureau,” Germuska says. “Our problem is a lot easier, because we’re able to draw circles around what we do and don’t do. I would love to see better government data provision, and I hope it keeps getting better, and I’ll share my opinion and experience with anyone that wants to know — but I have a lot of sympathy.”
The goal for Census Reporter was not only to make census data available, but to build a tool that makes it easier for reporters to understand what census data can tell them. Census Reporter looks at only a single body of data, but census numbers have long served as a way for reporters to grow their skills obtaining and understanding data.
“I think there is a certain kind of literacy that can be acquired,” says Schnadt. “Having that particular cognitive syntactical skill set is so valuable, as we have access to larger and larger data sets. The site could be very hopeful to lots of people outside the journalism world as well.”


