We sift through the academic journals so you don’t have to. Here are 10 of the most interesting studies about social and digital media published in 2015.
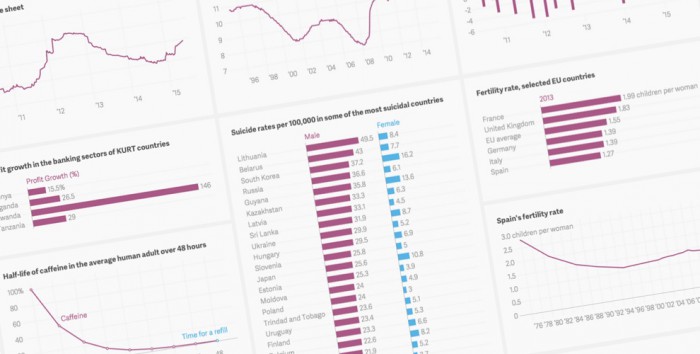
The data visualization expert argues that FiveThirtyEight and Vox have overpromised and underdelivered — and that they need to treat their data with more scientific rigor.
Cairo, Alberto. "Alberto Cairo: Data journalism needs to up its own standards." Nieman Journalism Lab. Nieman Foundation for Journalism at Harvard, 9 Jul. 2014. Web. 24 Jul. 2024.
APA
Cairo, A. (2014, Jul. 9). Alberto Cairo: Data journalism needs to up its own standards. Nieman Journalism Lab. Retrieved July 24, 2024, from https://www.niemanlab.org/2014/07/alberto-cairo-data-journalism-needs-to-up-its-own-standards/
Chicago
Cairo, Alberto. "Alberto Cairo: Data journalism needs to up its own standards." Nieman Journalism Lab. Last modified July 9, 2014. Accessed July 24, 2024. https://www.niemanlab.org/2014/07/alberto-cairo-data-journalism-needs-to-up-its-own-standards/.
Wikipedia
{{cite web
| url = https://www.niemanlab.org/2014/07/alberto-cairo-data-journalism-needs-to-up-its-own-standards/
| title = Alberto Cairo: Data journalism needs to up its own standards
| last = Cairo
| first = Alberto
| work = [[Nieman Journalism Lab]]
| date = 9 July 2014
| accessdate = 24 July 2024
| ref = {{harvid|Cairo|2014}}
}}