Nieman Foundation at Harvard
Some of the most exciting work taking place in The New York Times building is being done on the 28th floor, in the paper’s Research and Development Lab. The group serves essentially as a skunkworks project for a news institution that stands to benefit, financially and otherwise, from creative thinking; as Michael Zimbalist, the Times’ vice president of R&D, puts it, the team is “investigating the ideas at the edges of today and thinking about how they’re going to impact business decisions tomorrow.” (For more on the group’s doings, check out the series of videos that we shot there a couple of years ago.)
Much of the R&D Lab’s work, up to now, has been focused on platforms: tablets, TVs, screens, clouds. But the group is also thinking beyond gadgetry to two big ideas that are also a preoccupation of the news industry as a whole: the social sharing of news on the one hand, and the real-time processing of data on the other.
For the past several months, the R&D Lab has been working, quietly, on a time-based representation of how the Times’ news content is being shared in Twitter’s social space. Its name: Project Cascade. Superficially, it’s a data visualization, but it’s actually a tool that could, ever so slightly, change the way we think about online engagement.
It’s the product of a collaboration among Mark Hansen, the UCLA stats professor who spent a spring 2010 sabbatical working at the Times as what Zimbalist calls the paper’s “futurist-in-residence” — that casual title alone offers evidence of the scope of the R&D Lab’s ambition — along with Jer Thorp (data artist in residence) and Jake Porway (data scientist). And it has, despite its pragmatic uses, a firmly artistic attitude: Hansen, along with the artist Ben Rubin, designed the “Moveable Type” screen installation in the Times’ lobby, and Thorp, whose work we’ve written about previously, has converted data from the Times’ API into visualizations that are both revealing and stunning.
The team had access to a trove of usage data for Times stories, and wanted to figure out a way to see and understand the life those stories adopt once they leave the newsroom’s confines and go out into the world. The tool, which focuses on Twitter and uses information from the Bit.ly URL shortener, is their solution. “What it attempts to do,” Zimbalist says, “is dimensionalize and make really physical and tangible the way that news is shared.”
Yesterday afternoon, the team gave me a demo of the tool, which, in ultra-widescreen form, lives on a series of screens embedded in a wall outside the R&D Lab. And though, at this point, we’re all familiar with the wonders of social analytics, the tool distinguishes itself for the fact that it treats people not (well, not just) as data points, but rather as information agents — active participants in news consumption. One of the problems journalism, as an institution, has had in fully engaging its audience (and, relatedly, in engendering that audience’s trust) has been logistical: News outlets simply haven’t had the tools that would allow them to understand their readers — and to understand, at levels both broad and detailed, how those readers engage with their content.
The tool is framed around the social science-based concept of the “cascade” — in this case, the chain of events that propels a story through and around social networks. (I might come across and an article in the Times and tweet it out; Justin might see my tweet, and simply retweet it; Andrew might see Justin’s tweet, read the article, and then tweet it out with an entirely new framing. And on and on.)
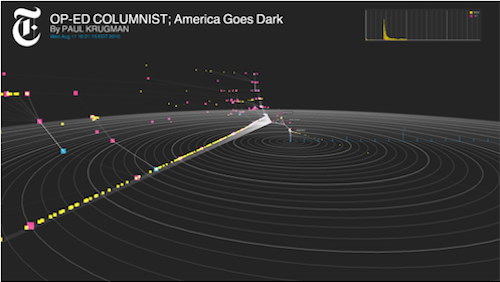
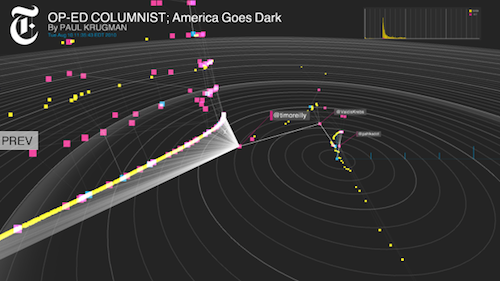
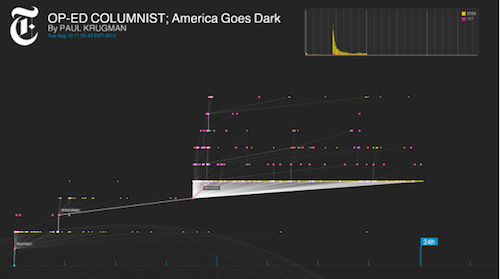
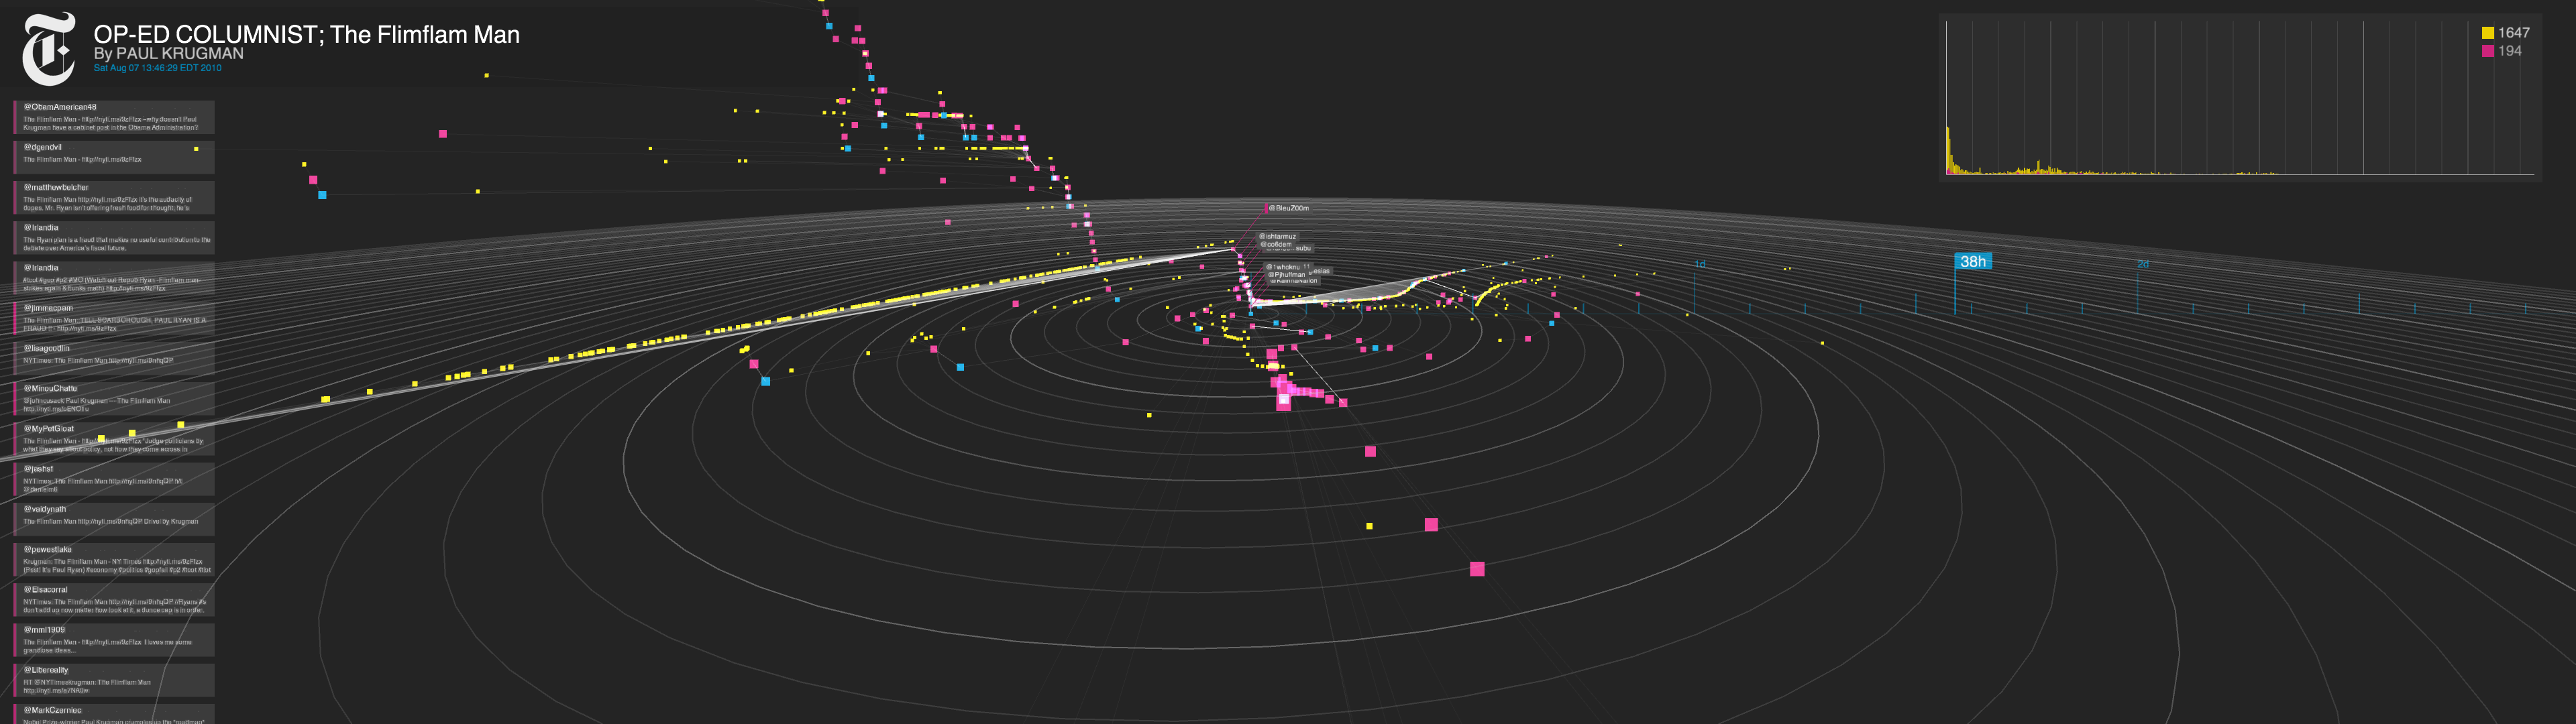
Project Cascade — it’s a working title — lets you visualize a cascade as a comprehensive unit; it also allows viewers to zoom in on particular events to see key points in how a story’s sharing activity has unfolded. Its side view demonstrates a (relatively) simple timeline of a story’s activity; its radar view demonstrates the separation between conversations; and its 3D view essentially marries the two, representing individual threads of conversation in a sharper way. Complex cascades can also be pruned to show only the most influential tweets (what Thorp calls the “backbone” of the conversation), and the users who posted them.
(To see some beautiful screenshots, bigger than what we can fit here, try here, here, here, here, and here.)
In all, the tool illustrates the connections between readers and publishers; identifies the most influential contributors to a conversation; and displays the overall life cycle of a news sharing event. It can see how the content of a tweet — or of the story it links to — affects that impact. It can determine which variables — time-of-day, day-of-week, and the like — change clickthrough and retweet trends.
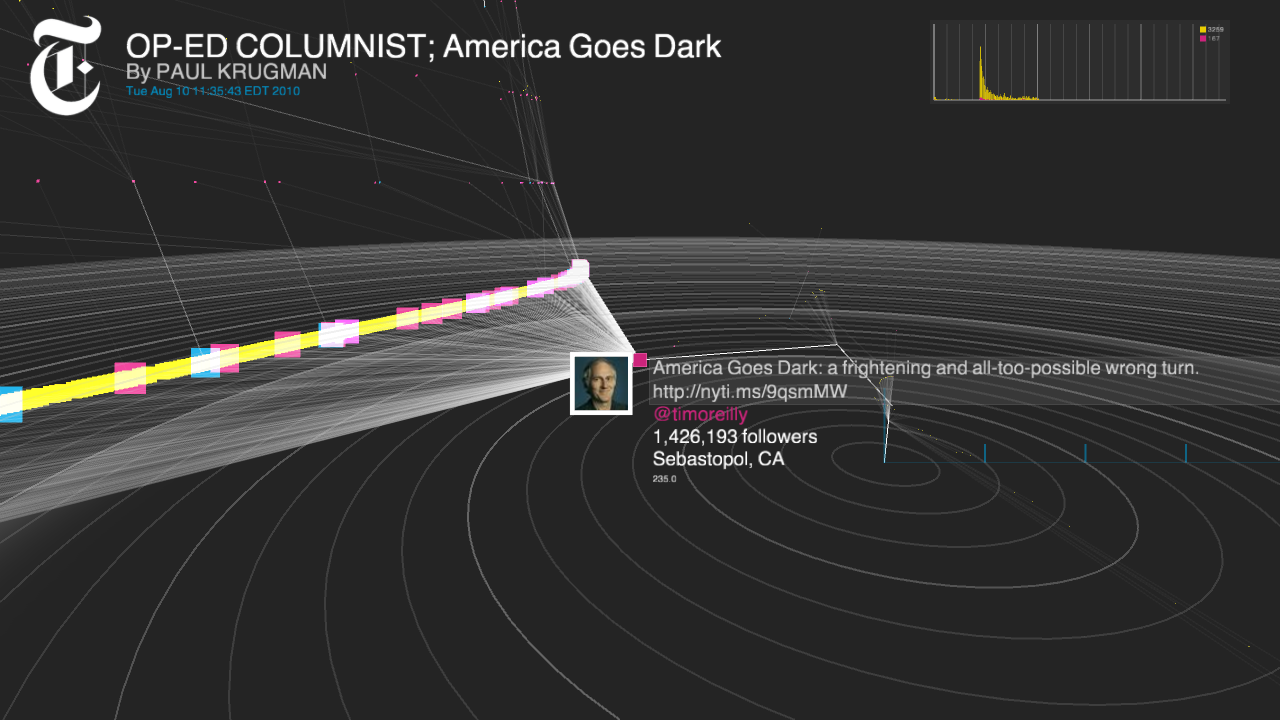
And it can assess the link-level impact of individual users. Who are the people, exactly, who drive other people to tweet about a link? That impact isn’t just a function of follower counts; in fact, often, the most-followed people don’t generate many retweets — possibly because their followers assume others have already seen the link. Project Cascade’s findings so far suggest, though, that it’s the people who are followed by the famous people who can drive a lot of retweet activity and drive discussions — “the deep, hidden influencers,” Zimbalist calls them, who can help news content have impact.
“These aren’t the kinds of things you would have seen in spreadsheets,” Porway notes. Static representations like spreadsheets don’t demonstrate well the human connections behind content-sharing the way that a visualized, animated universe can. With a 3D representation of interaction, you can see how interest groups — both ad hoc and ongoing, weak-tied and strong — form around particular pieces, and varieties, of content. “What we’re already beginning to see here,” Zimbalist says, “is these different clusters of people in these different vertical areas who are always out there talking about our content.”
And — here’s where things get really interesting — the Times could then bring in those influential news-spreaders to become news…producers. With the tool, “we’ve seen this little community discussion that we would have never been able to filter out of the noise before,” Thorp notes. And, with that insight, “you could imagine a world where people in the newsroom would be like, ‘That’s interesting. There are these three rabbis who are discussing this — maybe we can bring them in to have a debate about it.'”
“So we can identify these people, and maybe we can access their expertise or access their experience — as well as think about, ‘How can we drive more traffic?'”
For now, for its experimental period, Project Cascade uses a data set of Times articles from a two-week period from August 2010 — a period without a single, dominating news event. So it includes intriguing info about, say, the social life of the Times’ coverage of Steve “EvacuSlide” Slater, the JetBlue flight attendant — whose life on Twitter was extended by, among other things, the Times story’s constant updates (and by Brian Stelter‘s tweets informing his followers about those updates). But the hope, and the point, is to move beyond the proof-of-concept period and begin feeding the data for all Times stories, in real time, into the system.
Real-time analysis is of obvious use beyond the Times, so the newspaper is thinking about — way down the road — sharing the tool. “It’s been a theory of ours for the last year or so that the organizations that are able to make business decisions based upon large amounts of data coming in real time are going to be the winners of the 21st century,” Zimbalist notes. Project Cascade is the double-down on that theory.
![]() The team emphasizes that Project Cascade and its findings won’t necessarily dictate, or even affect, editorial decisions. But they could affect the packaging of stories and the way the Times presents them online. Particularly in a dynamic environment like Twitter, small decisions about presentation of content can have a big effect on how much that content gets shared. And the Times is not alone in thinking about how reporters, for example, should be thinking about and using social networks in their work; best practices can be valuable.
The team emphasizes that Project Cascade and its findings won’t necessarily dictate, or even affect, editorial decisions. But they could affect the packaging of stories and the way the Times presents them online. Particularly in a dynamic environment like Twitter, small decisions about presentation of content can have a big effect on how much that content gets shared. And the Times is not alone in thinking about how reporters, for example, should be thinking about and using social networks in their work; best practices can be valuable.
The Project Cascade tool can also, intriguingly, help its users learn much more about the social elements of online news distribution. “In effect, what we’re trying to do is think about notions of influence that are based not just on the social graph, but instead how that graph gets exercised,” Hansen says. Or, in much more basic terms: to understand the audience — not as a passive monolith, but as a series of active individuals who happen also to be nodes in a network. The ability to comprehend communities will be crucial for organizations of all kinds going forward, news orgs first among those. Of the communities that form online, “do they represent different opinion groups?” Thorp says. “Do they represent different geographic groups? Do they represent groups that we’ve never identified before? Those are some questions that we can ask.”


