How do Indian news audiences navigate the online news domain? Can one find patterns of audience fragmentation in the Indian media ecosystem?
At the Reuters Institute for the Study of Journalism, we recently analyzed the behavior of online news audiences in India during the 2019 general elections to understand news consumption in a unique market in the Global South that is characterized by rapid growth in internet penetration, and that has witnessed a surge in the number of digital-born outlets that compete with legacy media for attention and engagement. Given the dearth of empirical studies about news audience behavior in the world’s largest democracy, our study provides a benchmark for future comparative research on news consumption across platforms and across countries to build on.
In this study, our team of researchers (Silvia Majó-Vázquez, Subhayan Mukerjee, Taberez Ahmed Neyazi, and Rasmus Kleis Nielsen) found that online news consumption patterns in India do not polarize along the predicted ideological divides in the country. In other words, our evidence suggests that the online Indian audience widely navigates the news environment without showing signs of specialization and selectivity, ideological or otherwise.
We also find that Indian-language vernacular media dominate news provision on Facebook and that digital-born outlets are more effective at engaging audiences on social media platforms than legacy outlets, despite their smaller overall reach.
We used the Indian general election as a case study and collected and analyzed cross-platform audience data from social media — Facebook and Twitter — as well as the open web. The Indian general election is known for being the largest democratic exercise in the world. This spring, when the country embarked on a six-week-long vote to fill the seats of the lower house of the parliament, a staggering 900 million people were called to the polls and the voter turnout was pegged at an all-time high of 67 percent.
We used three unique datasets that tracked Indian audience behavior across multiple online platforms. We started with a strategic sample of 101 news media outlets. We obtained nearly 66,000 Facebook posts (in English and 8 other more popular vernacular languages) and over 63 million tweets that had been sent by the 73 official Facebook pages and 78 official Twitter handles of these media outlets. We also collected web traffic data, when available, for all 101 news outlets in the period leading up to the elections.
We found significant differences between the kinds of news outlets that dominated the provision of political content on Facebook and on Twitter. As mentioned earlier, regional media outlets — most notably vernacular newspapers — were by far the most prolific on Facebook in posting political news, with national television outlets at a distant second.
On Twitter, however, digital-born outlets and nationally circulated English dailies were the most active. This was perhaps owing to Twitter’s more urban, elite, and English-speaking user base compared to Facebook’s.
On the demand side, digital-born outlets (both national as well as regional/vernacular) enjoyed significantly higher levels of audience engagement on Twitter and Facebook in comparison to legacy media outlets, despite the latter being more active on the supply side. When we delved deeper into the types of content that attracted higher levels of audience engagement, we found that video narratives in general fared better. This suggests a potential path for news media outlets to further grow their audiences in India as larger sections of the country come online.
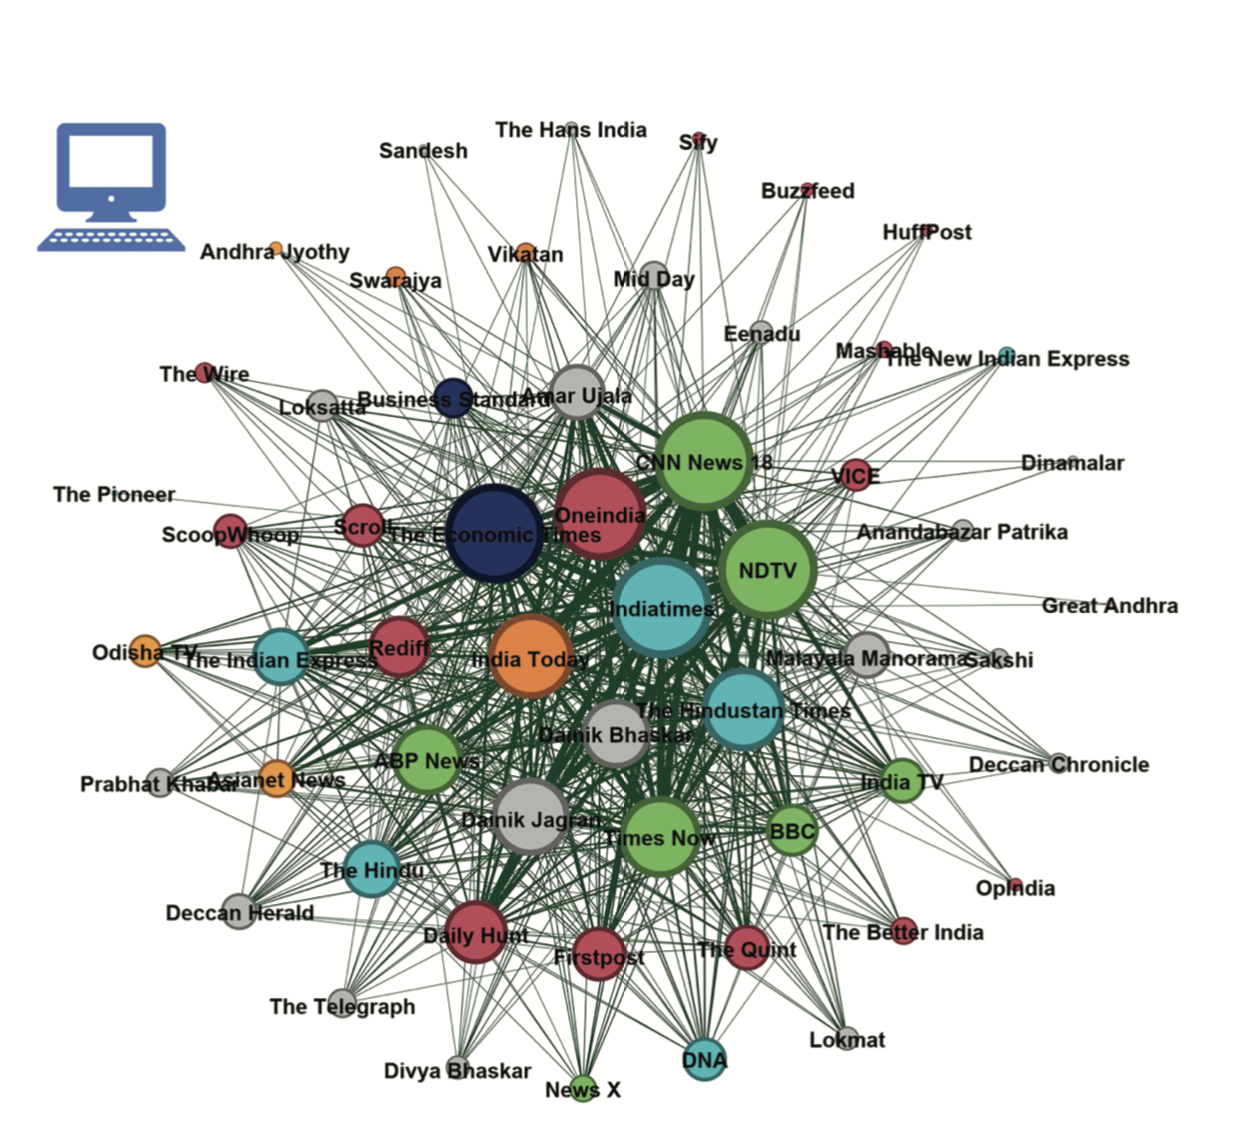
Finally, to answer the substantive question of whether news consumption patterns were indeed polarized or not at the structural level, we looked at web-traffic overlap data of news websites. We constructed network models of news consumption where each node in the network represented a news website and the edge joining pairs of nodes represented their shared audience:1

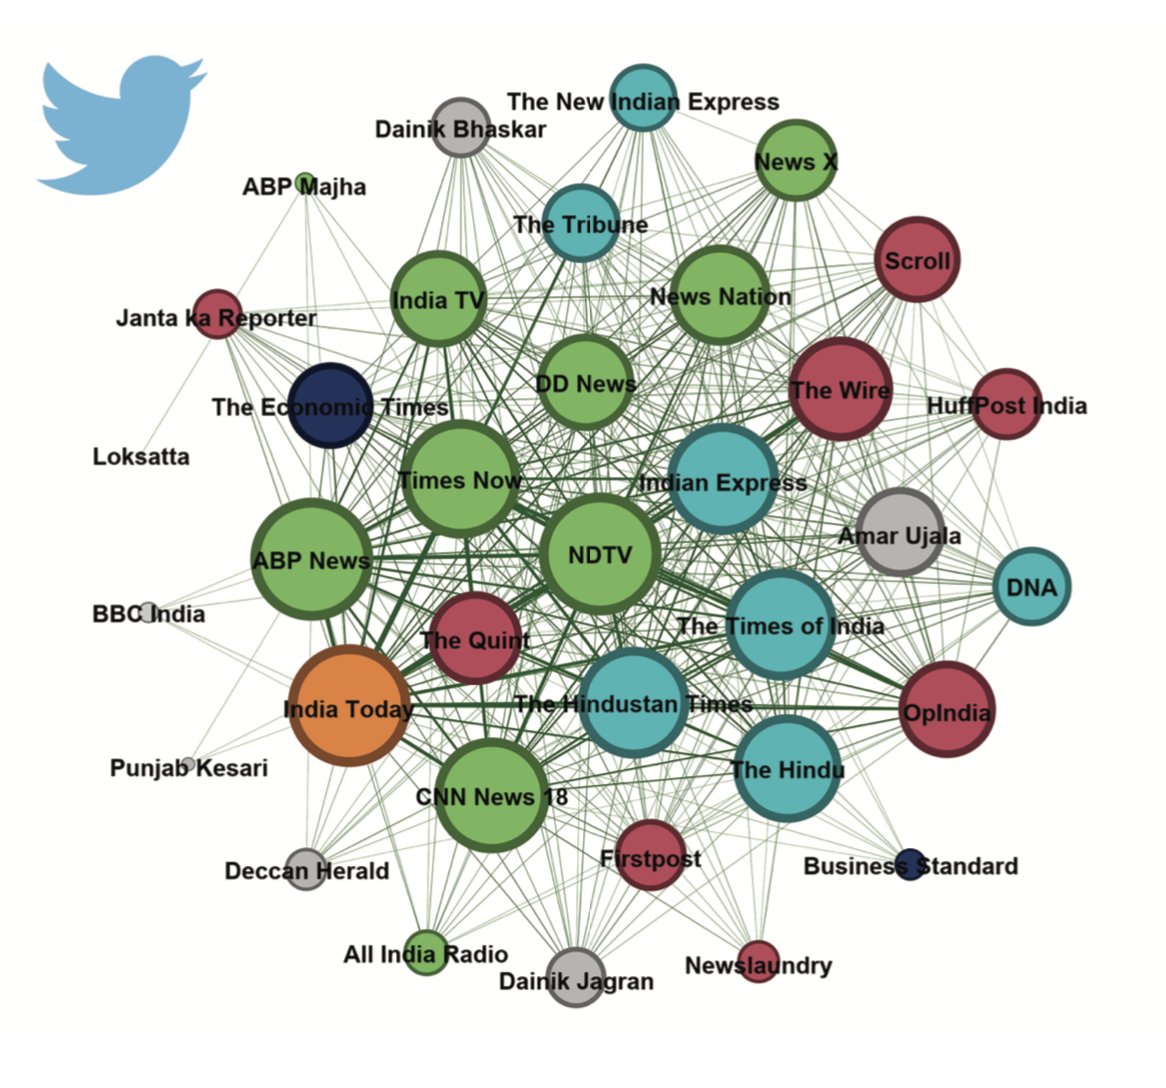
With the Twitter data that was available to us, we built a similar network model of media outlets, linked together by means of their shared interactions (retweets, mentions, and replies):2

For both network models, we applied a community detection algorithm to find how “modular” or “clustered” both networks were. In doing so, we found very little evidence to suggest that news consumption patterns had indeed polarized along any dimension, be it on Twitter or on the open web. This finding lent credence to the fact that despite fears of partisan polarization in India’s tumultuous political process, the “media diet” of Indian news consumers had been relatively diverse.
It serves as a reminder that online political debates are often coordinated and mobilized by politically invested, agenda-driven minorities, and amplified by attention-seeking media outlets. We find that such an impression of an ideologically fragmented political environment may not accurately reflect the ground reality in the country.