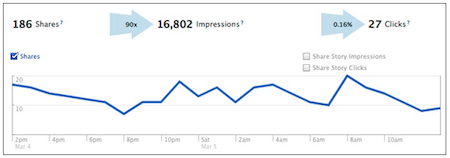
Facebook just launched a round of updates to Insights, its analytics tool for sites that feature its social networking plugins. The updates include a bunch of useful improvements — you can now measure impressions, Comments Box analytics, and Like button clickthrough rates (yep, that’s a thing now!) — but the most significant (and potentially quite awesome) of the updates is the addition of real-time analytics capabilities when it comes to measuring Facebook interaction. Think Chartbeat for social engagement.
Think also, though, Google Analytics for social engagement. Facebook has been expanding its role when it comes to its relationship with publishers — not only through its broad Facebook + Media efforts, but also through an array of new plugins designed to help news sites better understand (and, then, interact with) their readership. And the Insights updates, via aggregate (and anonymized) usage stats, provide data not just about traffic, but also about user demographics. It’s not just about how many people are liking (and, you know, Liking) your stuff; it’s about who’s liking it — according to age range, gender, location, and language.
Knowing all those demographics — some of which Google Analytics can’t provide — gives publishers the option of targeting their content (and with it, perhaps, their advertising) to specific user groups. And, given the real-time data, during specific times of the day.
The revamped Insights tool is, essentially, an invitation to publishers to experiment with how they present their content and, with it, their Facebook-integrated features. Is a Like button more effective at the top of stories, or below them? Or both? Do the majority of shares come organically — through cut-and-pasted links — or via plugins? (Yep, the updated Insights tool measures that, too.) Those small data points can make a big difference as far as traffic — and, obviously, user engagement — is concerned. Same deal from the Share/Like/Recommend perspective: Are your readers more inclined to distribute your content when it’s framed with a “Like” button, or a “Recommend”? Once you know, you can design accordingly.