Nieman Foundation at Harvard
Mike Bostock is one of data visualization’s leading lights. As creator of the hugely popular visualization library D3.js and editor in The New York Times’ graphics department, he has had a hand (visibly and invisibly) in most of the widely shared interactives on the web.
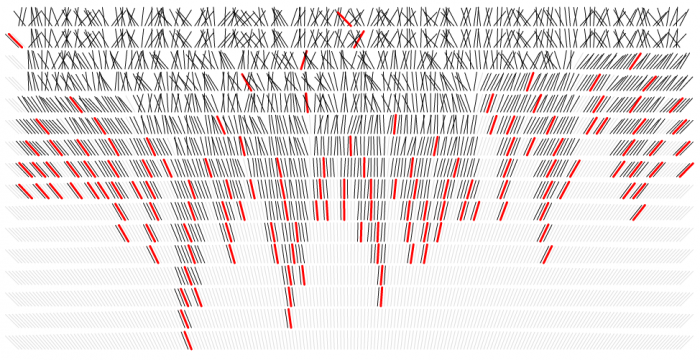
Today Bostock posted an adaptation of a celebrated talk he gave at Eyeo 2014 about visualizing algorithms. Full of ideas and gorgeous patterns, it’s an elegant flip to the script of the typical data visualization.
Computers are sometimes conceptually divided between data structures and algorithms, and we usually visualize the data, while ignoring the processes that manipulate it. But Bostock argues that “visualization is more than a tool for finding patterns in data.”
He breaks down various methods for sampling, shuffling, sorting, and making mazes, ably explaining (via text and gorgeous graphics) why there are different types of randomness, for example, or how to most effectively sort a list.
Bostock is interested in the value of visualizing algorithms for learning about and understanding complex processes. A novice could use a visualization to peer into an algorithm’s black box; an expert algorithm builder might visualize in order to debug and reframe it.
He classifies algorithm visualizations based on the level of introspection they give into the data — some only show the output, while others let you peer fully into how data points are being manipulated.
The goal here is to study the behavior of an algorithm rather than a specific dataset. Yet there is still data, necessarily — the data is derived from the execution of the algorithm. And this means we can use the type of derived data to classify algorithm visualizations.
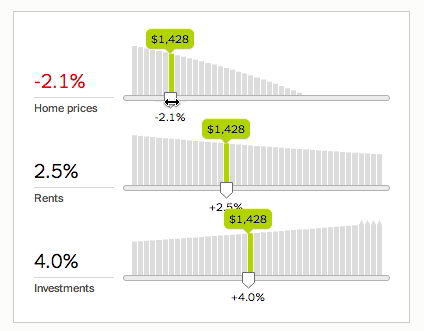
Using his work on the Times’ revamped rent-versus-buy calculator as an example, he shows how opening up the algorithm allows for new questions:
To output an accurate answer, the calculator needs accurate inputs. While some inputs are well-known (such as the length of your mortgage), others are difficult or impossible to predict. No one can say exactly how the stock market will perform, how much a specific home will appreciate or depreciate, or how the renting market will change over time.
We can make educated guesses at each variable — for example, looking at Case–Shiller data. But if the calculator is a black box, then readers can’t see how sensitive their answer is to small changes.
To fix this, we need to do more than output a single number. We need to show how the underlying system works.
Some of the examples are fairly technical and outwardly trivial — in a sense, what are the social implications of a sorting algorithm as long as the sorting happens? But they do demonstrate the sheer number of ways to solve a seemingly simple problem, and in the case of some of these examples (such as sampling algorithms), the results matter immensely.
The examples also demonstrate an opportunity to rethink what a visualization can tell us. Whether static or dynamic, or whether describing a state or a process, a visualization can show and hide as much as it needs.


Leave a comment